PopcornWritten by Paul BourkeJanuary 1991, Updated January 2018 Attributed to Clifford Pickover.
In the original description of the algorithm the points in the following series are drawn on a region of the image plane. The series is evaluated for initial values x0,y0 taken from a sampling of the image plane, for example each 10 pixels horizontally and vertically. Typical values of h are 0.05. yn+1 = yn - h sin(xn + tan(3 xn))
   Update
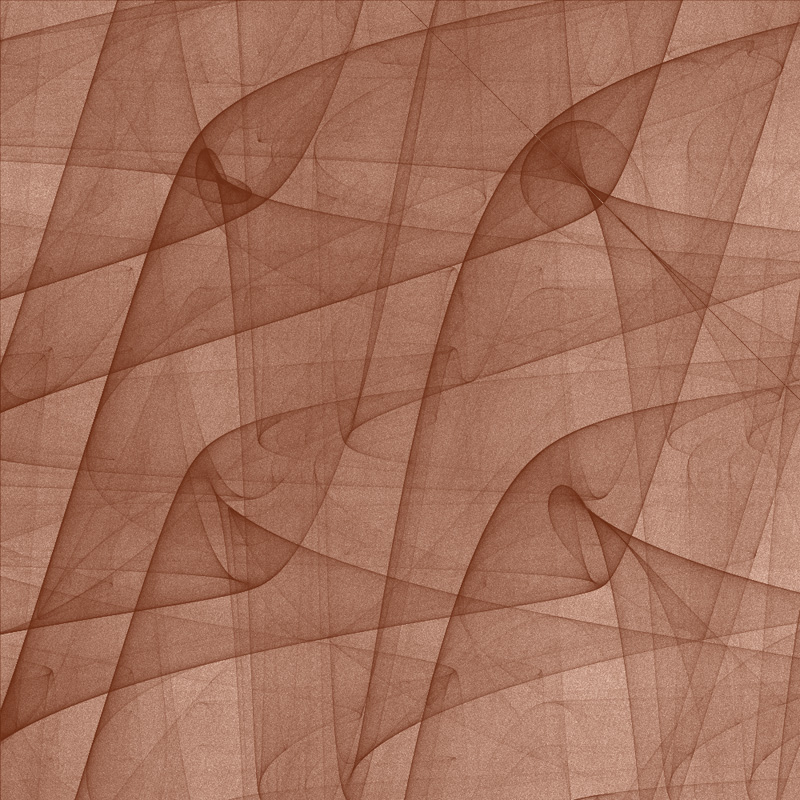
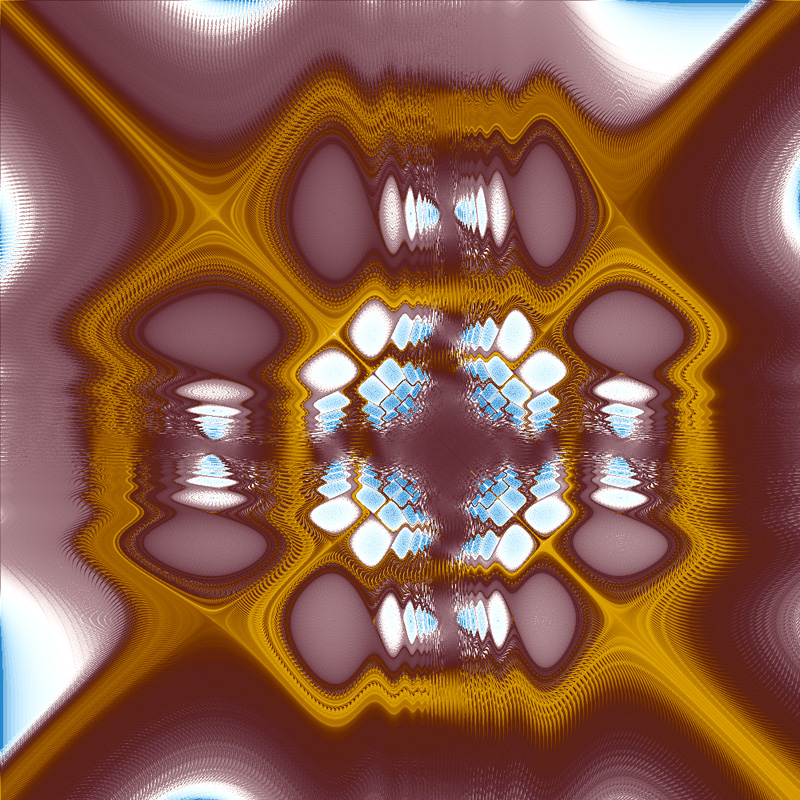
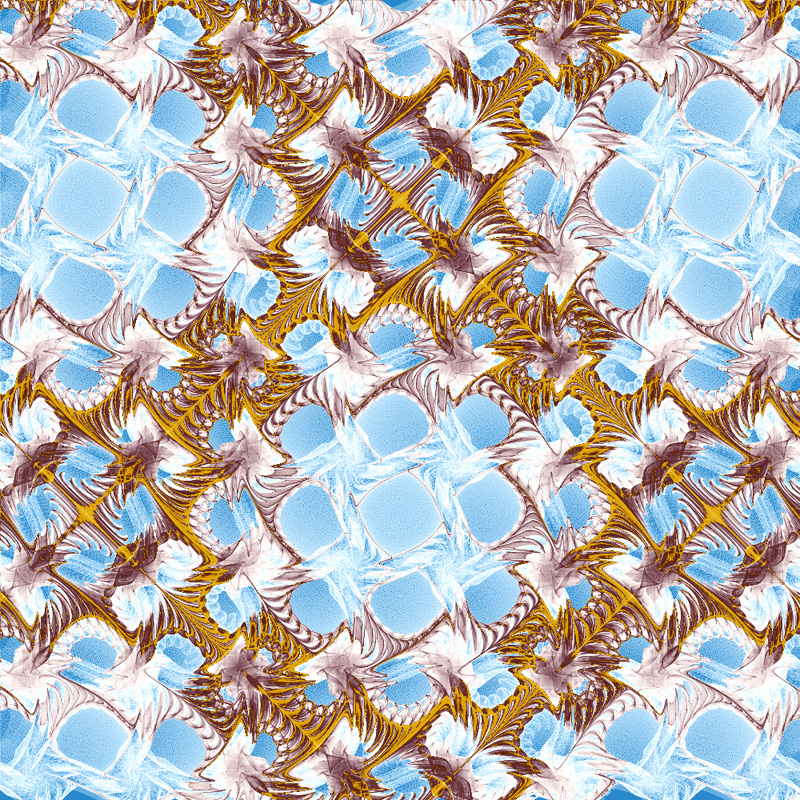
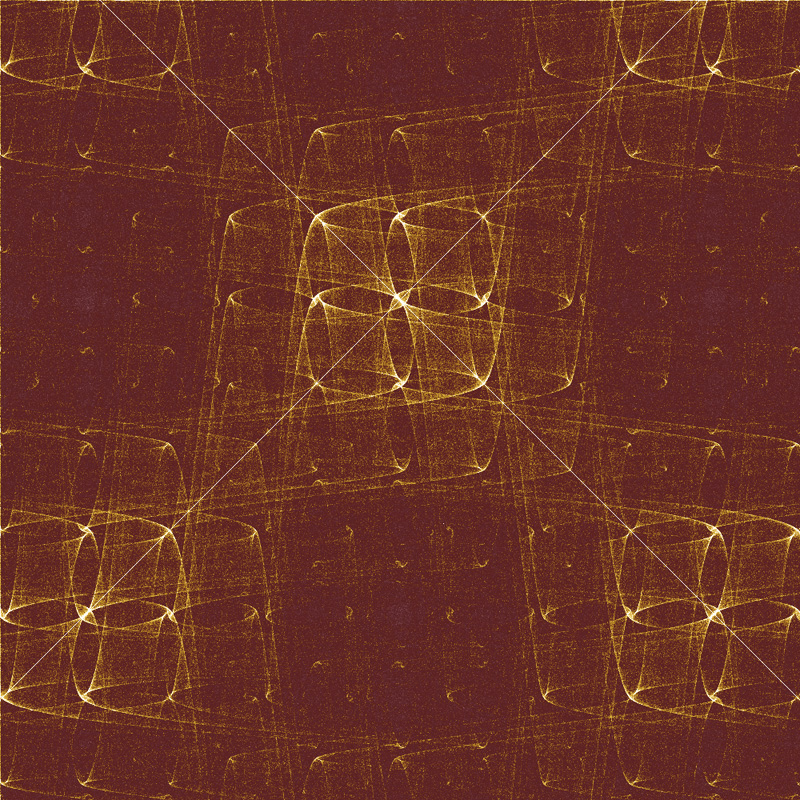
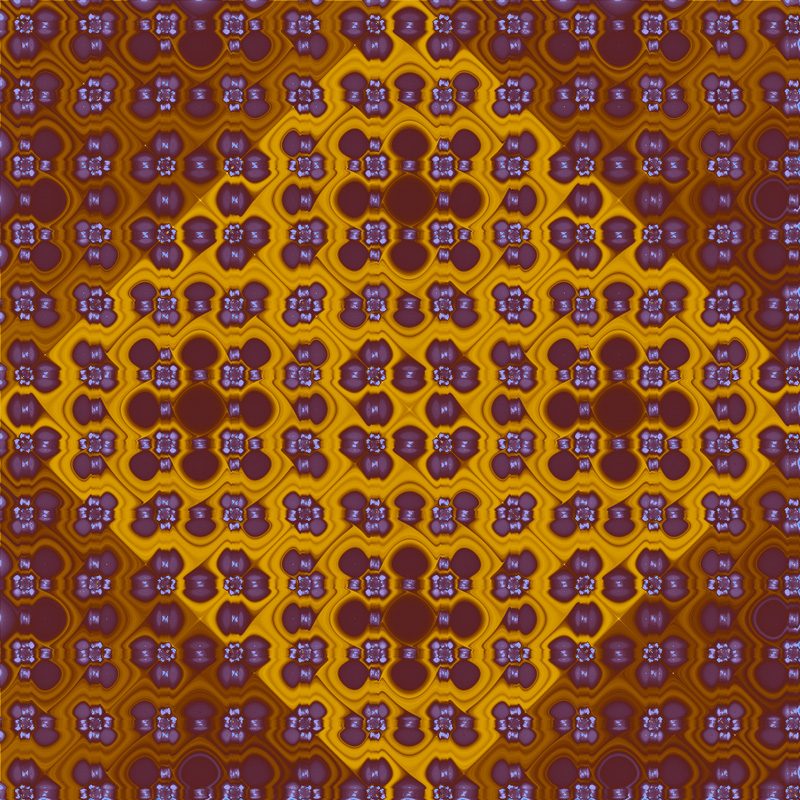
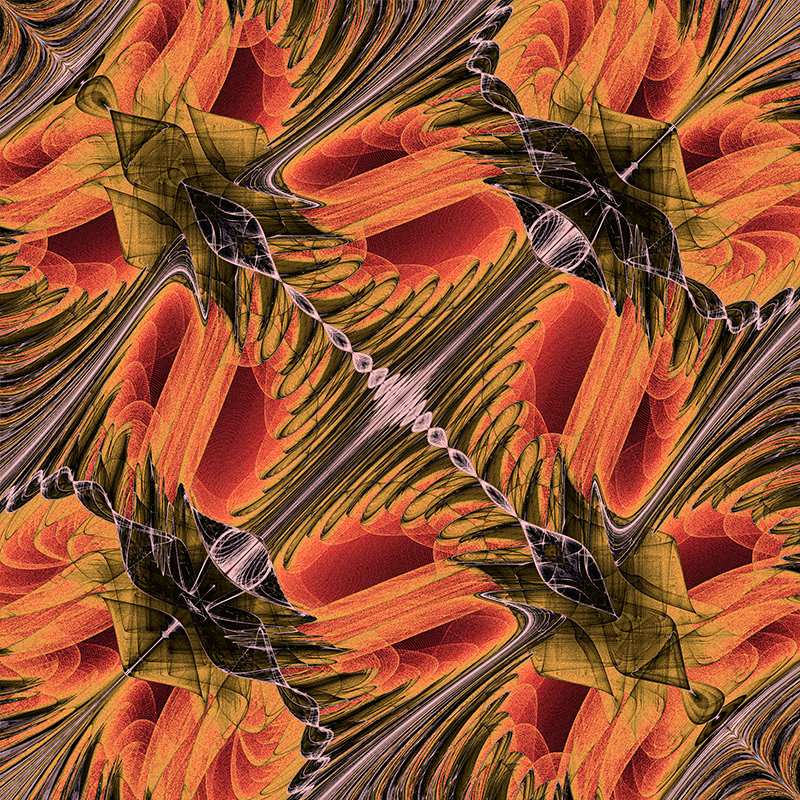
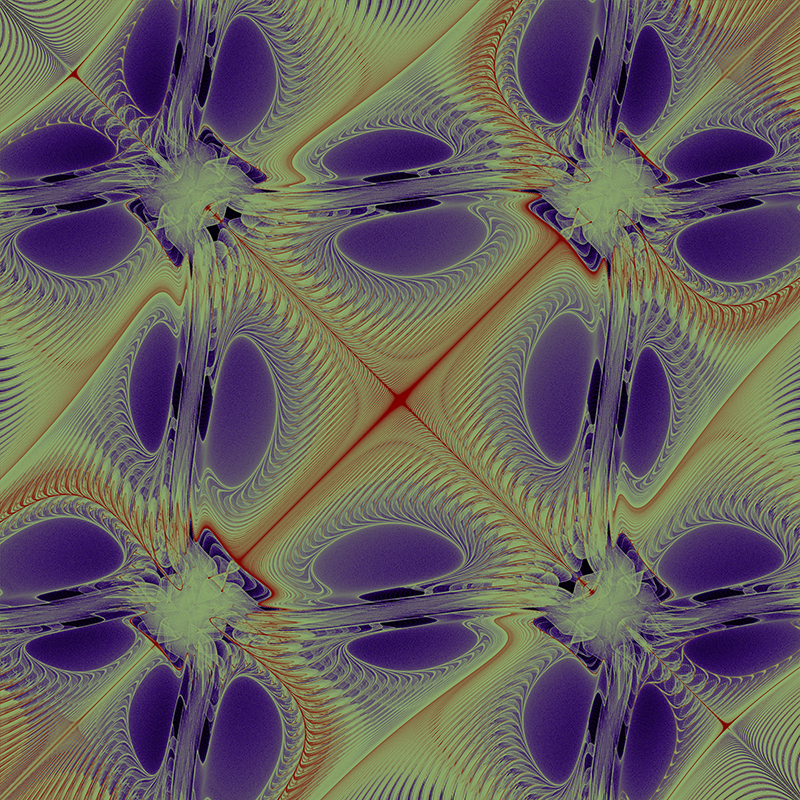
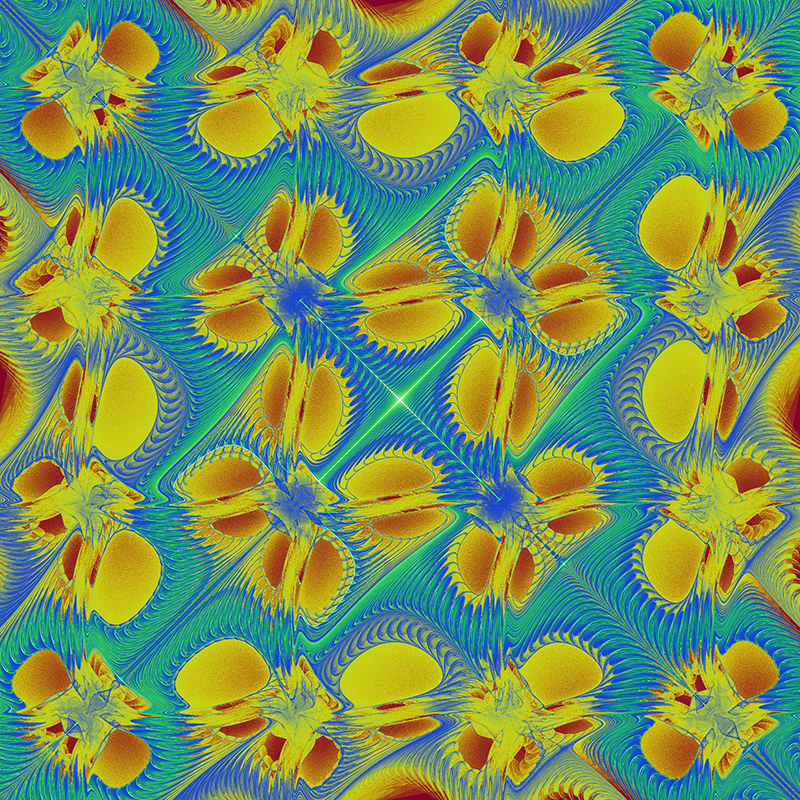
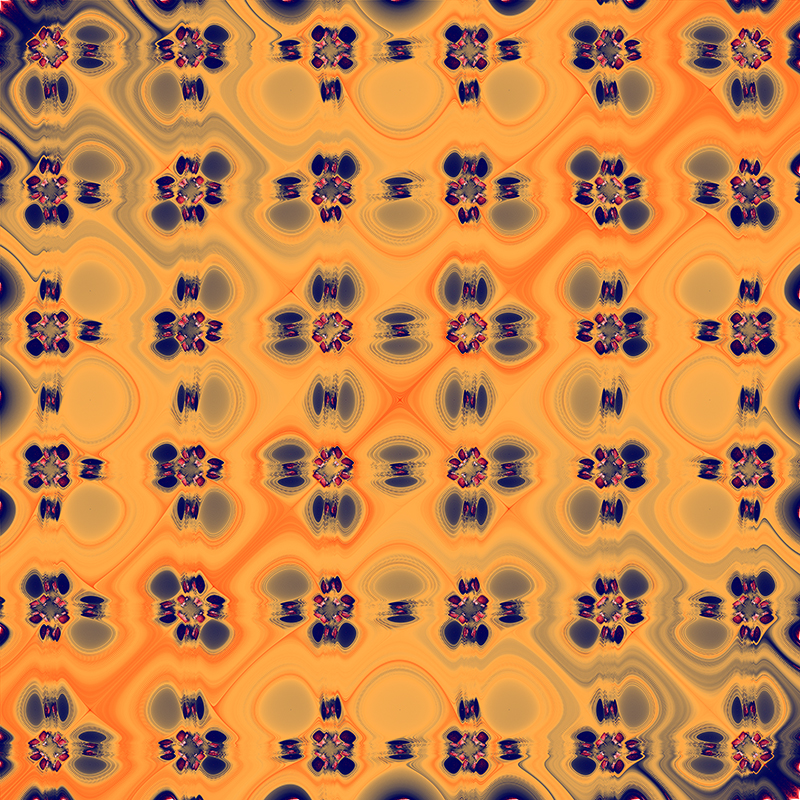
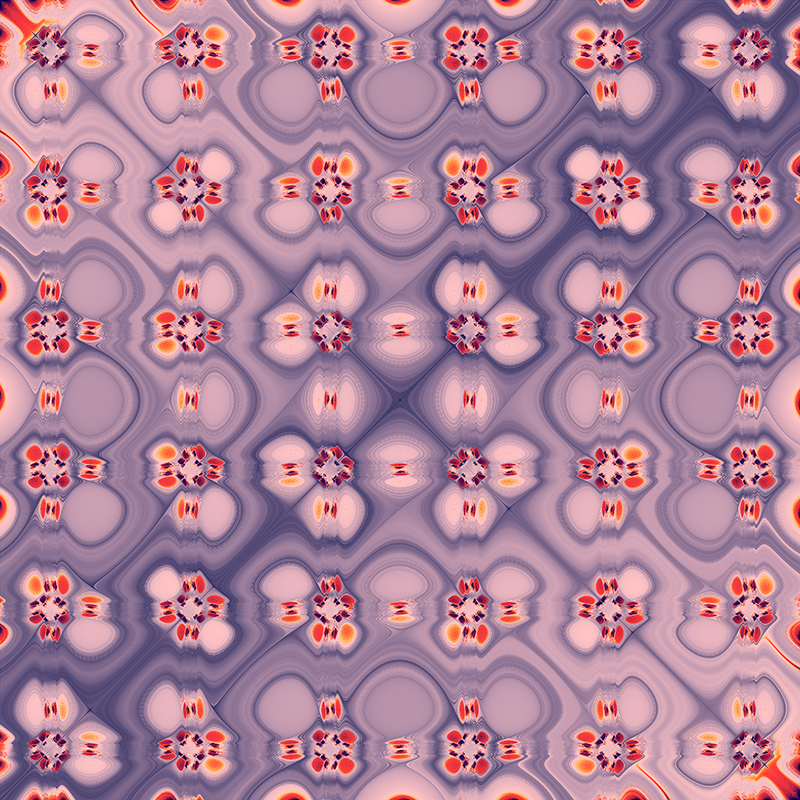
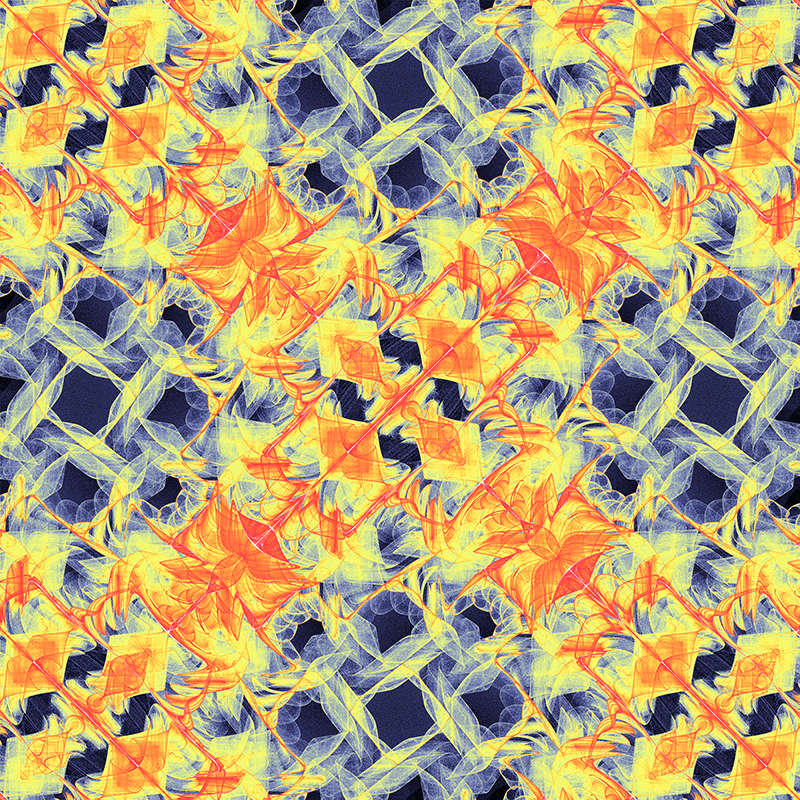
The traditional approach involving the evaluation the series at a subsampling of the points on the plane was largely due to limited graphics and processing power of the day. More continuous images can be created if every pixel is used as the initial conditions of the series, indeed one can even choose finer sub pixel samplings. Instead of drawing the series directly one forms a 2 dimensional histogram, every pixel in the image containing the number of times that position occurred during the evaluation of the series. The colouring of the histogram is then left as a post production exercise, mapping histogram value to some colour gradient. 


|