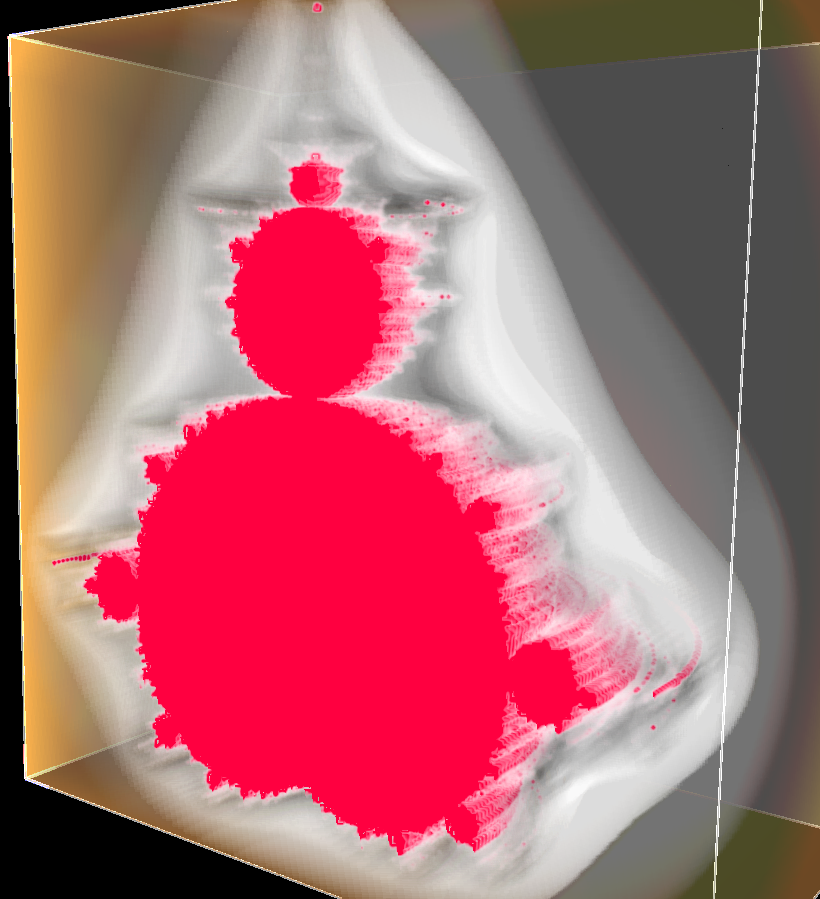
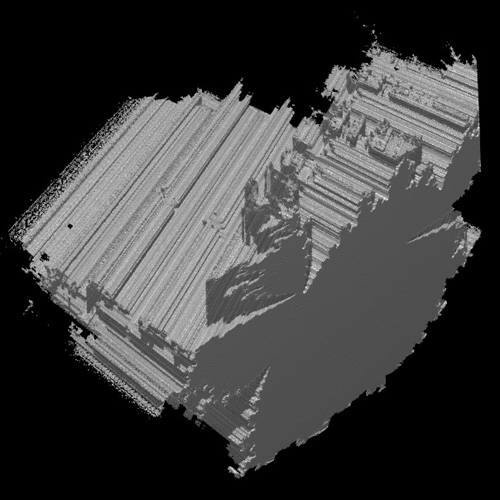
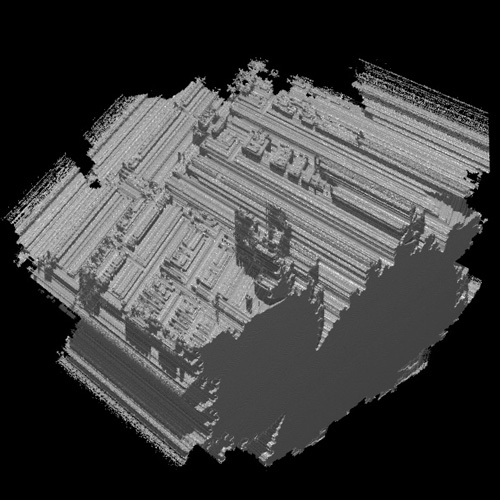
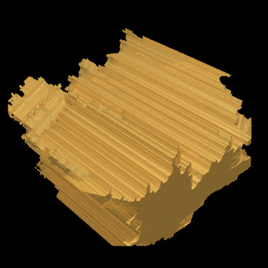
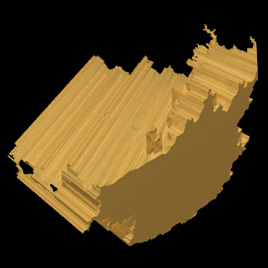
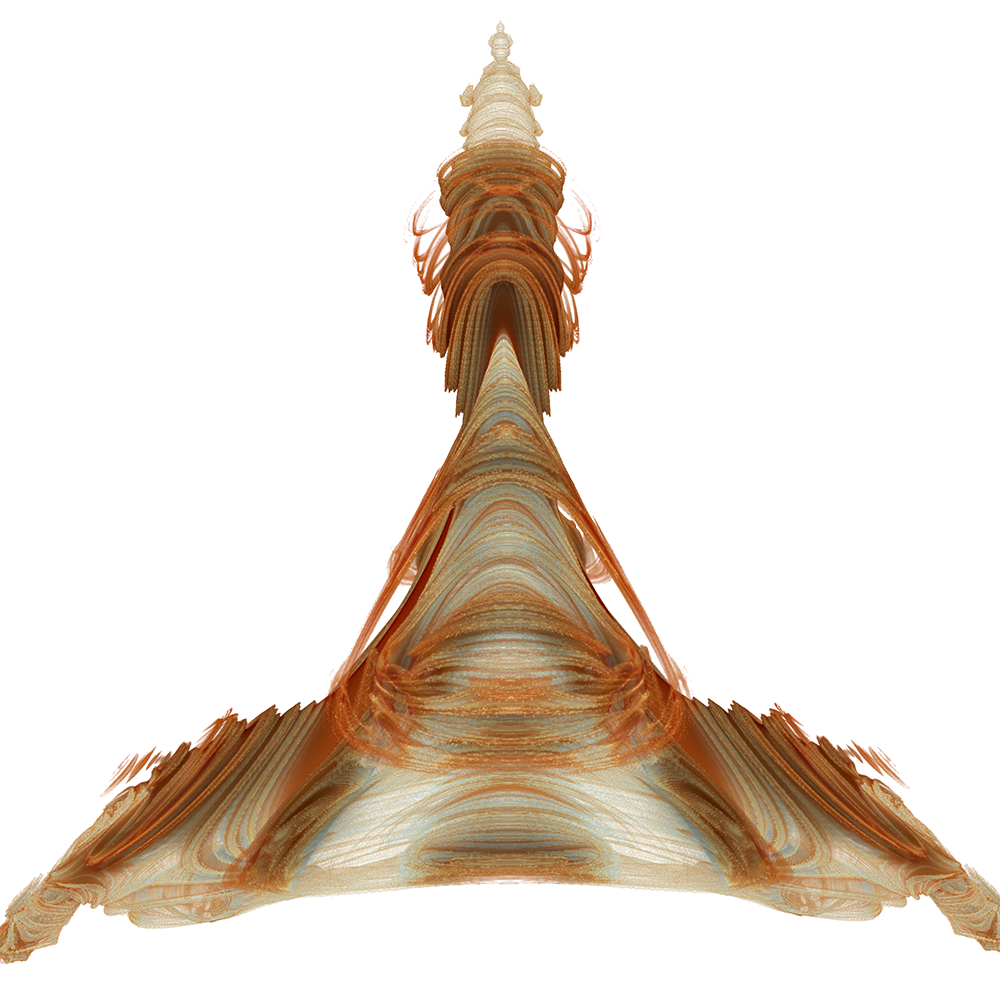
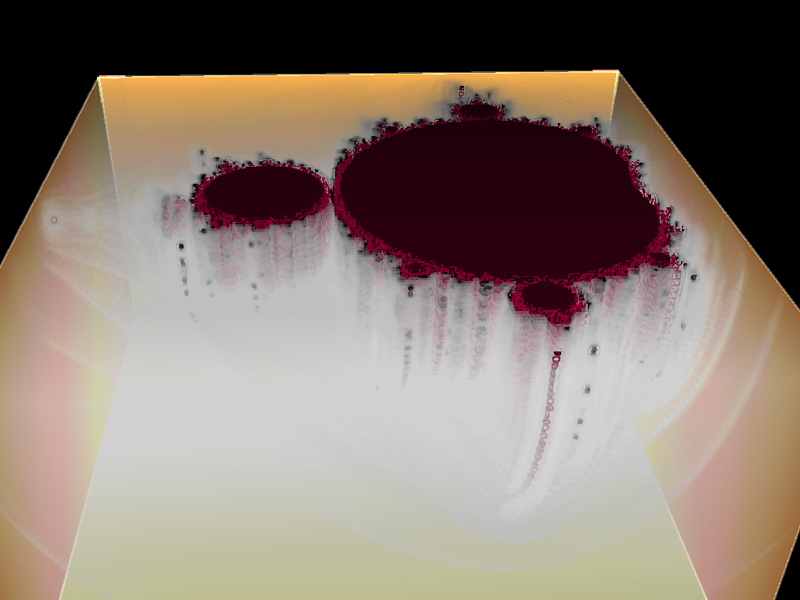
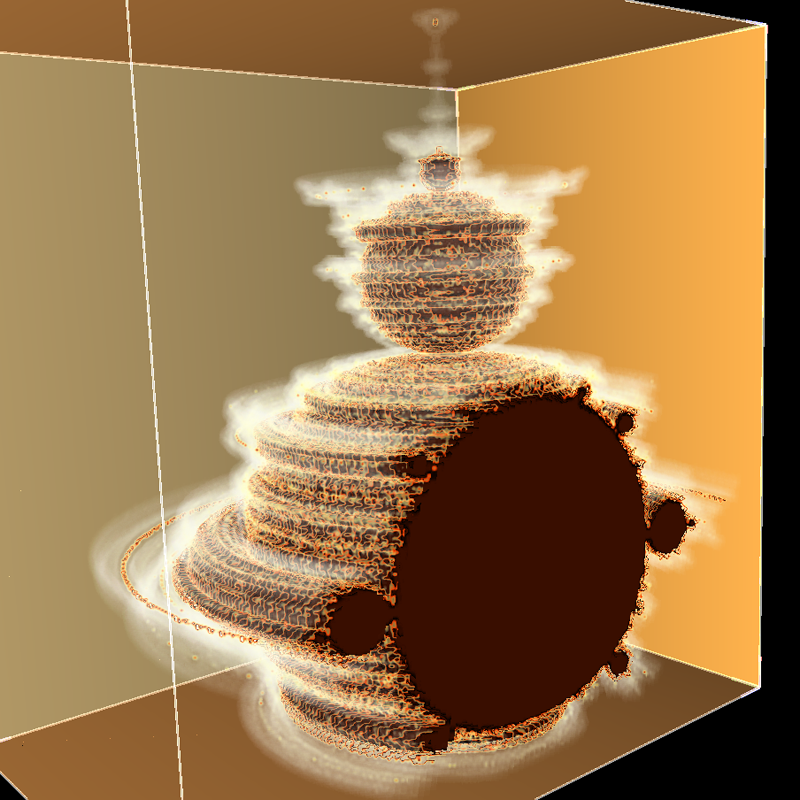
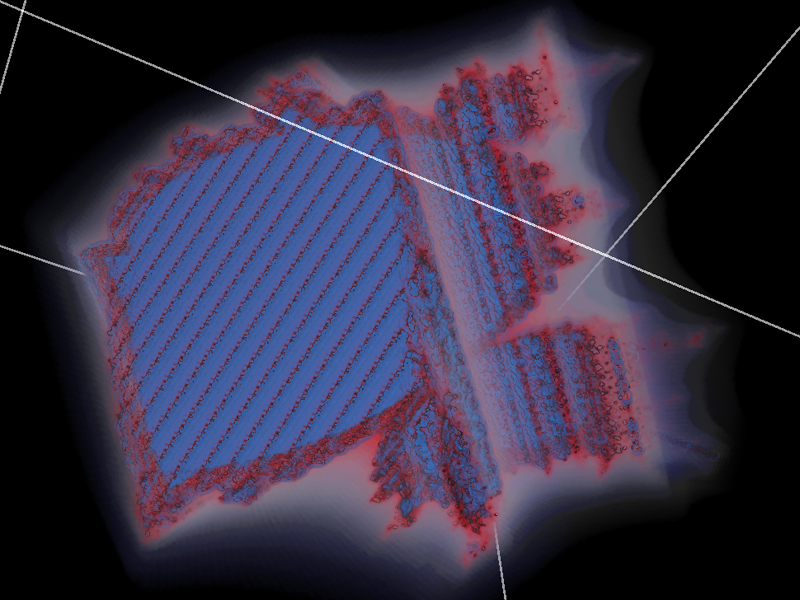
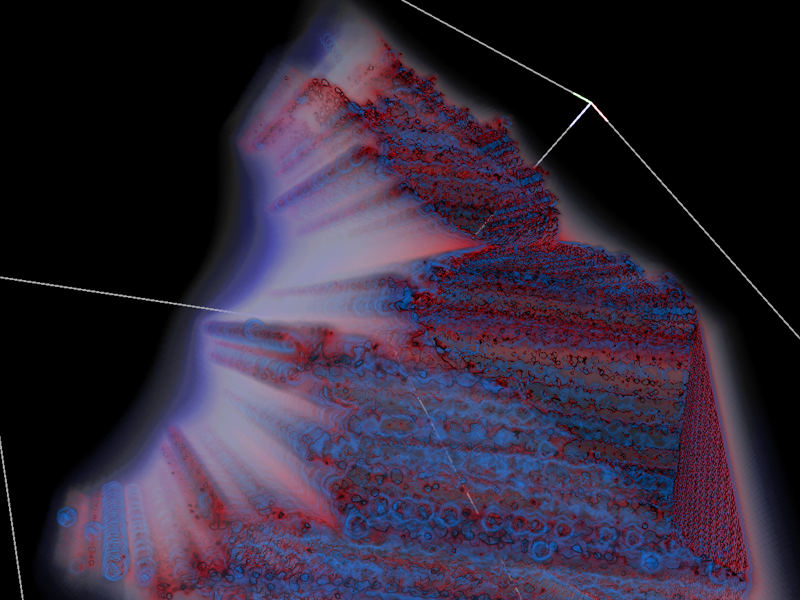
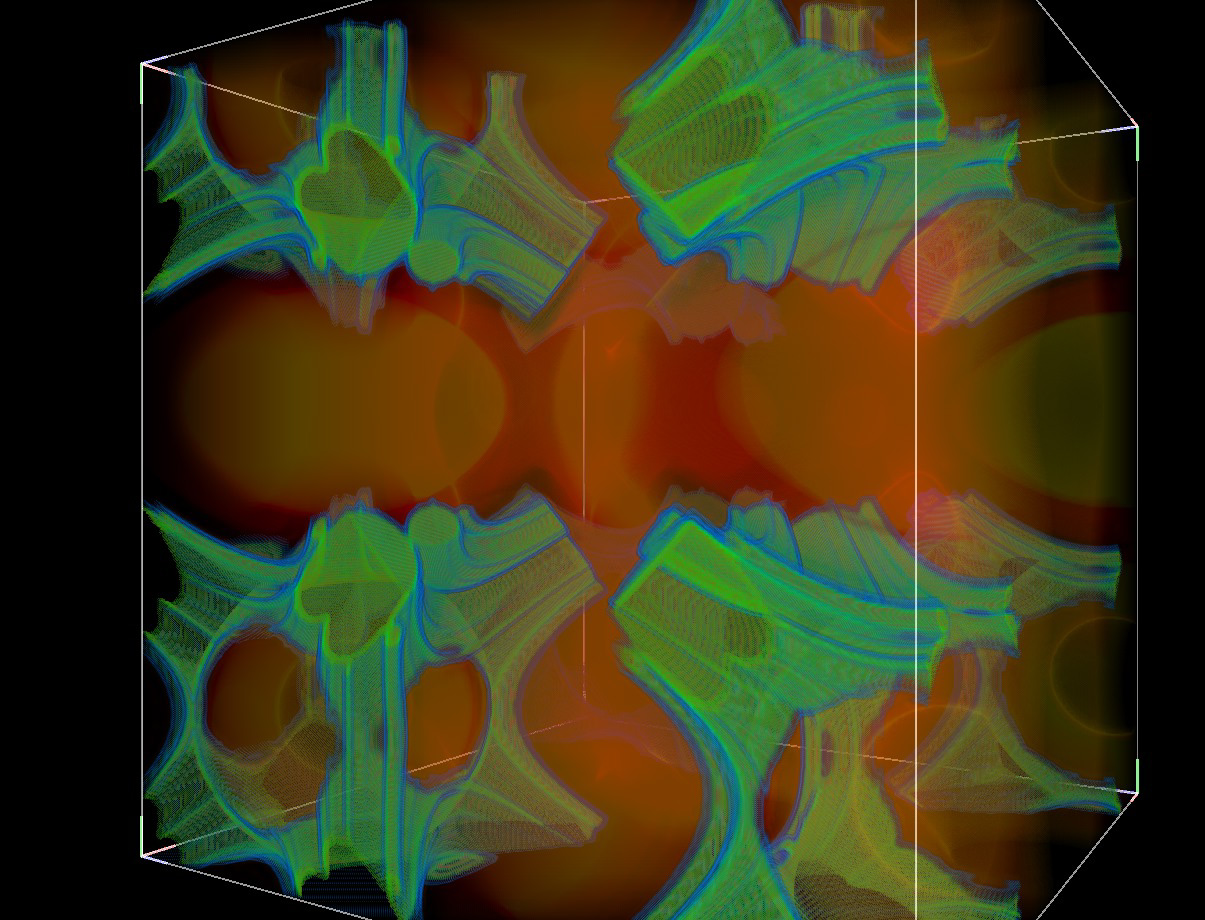
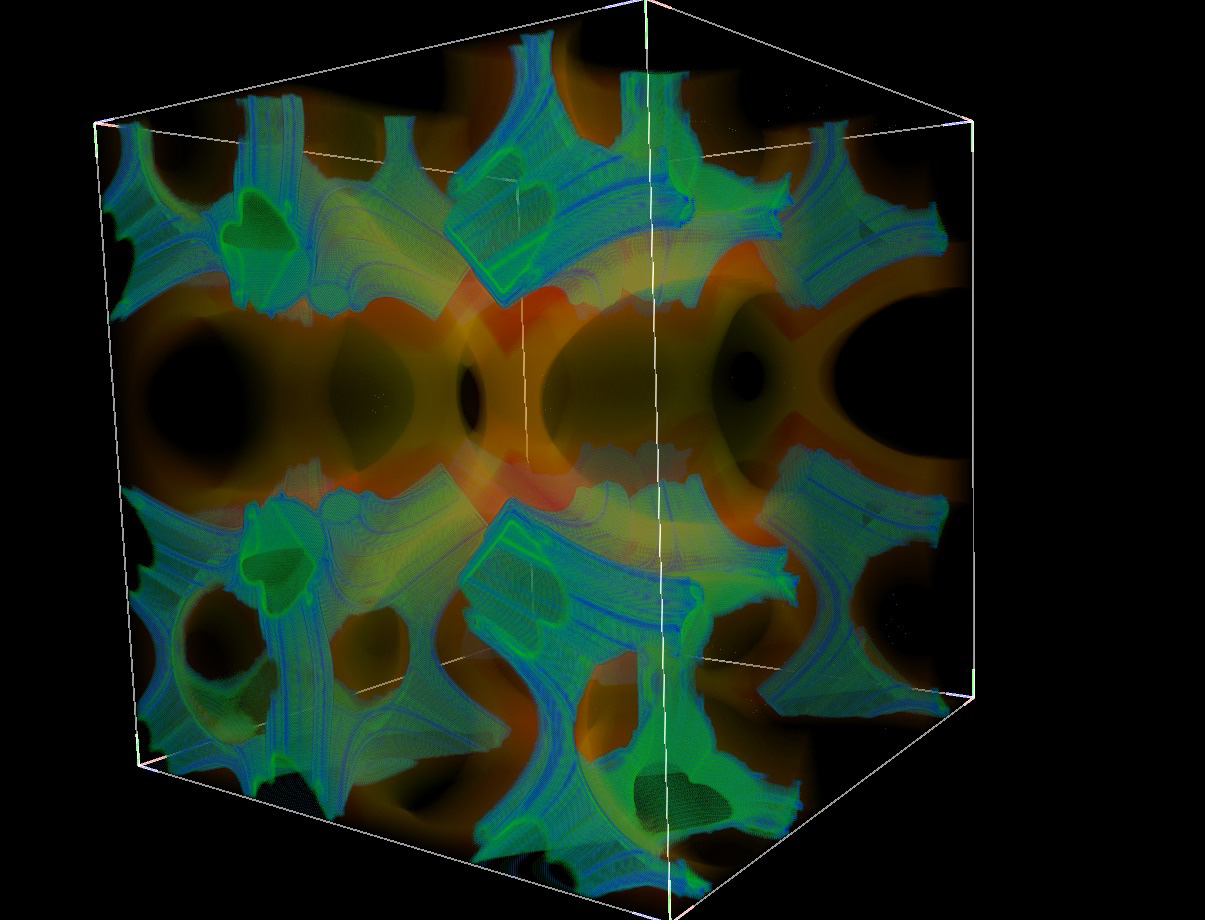
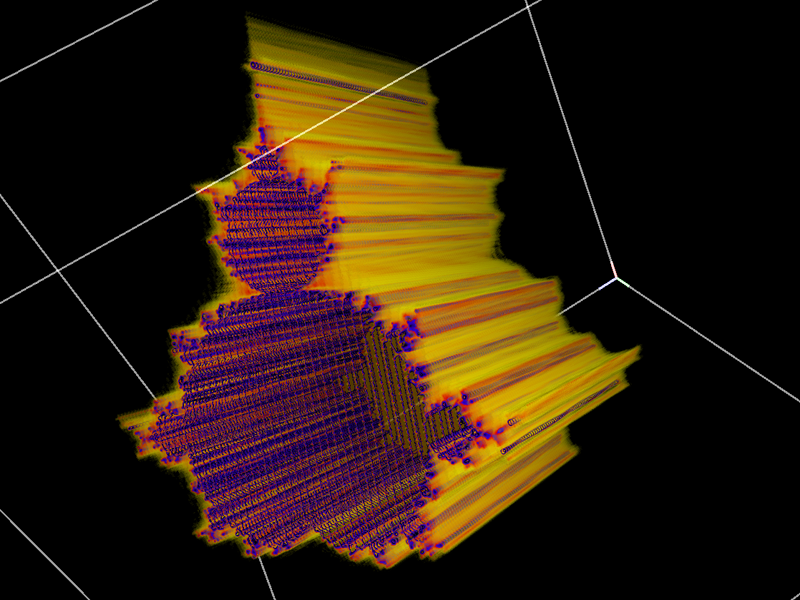
Bedouin FractalCreated by Paul BourkeAttributed to Russell Walsmith April 2016 See also: Visualising volumetric fractals
This is created by considering each point within some region of 3D space (x0,y0,z0) and evaluating the following series. The point (voxel in computer graphics language) is then assigned a scalar quantity depending on how quickly the series tends to infinity. yn+1 = b + sin(y0) zn+1 = c + sin(z0) where
b = 2 xn zn c = 2 xn yn
Rendering here done using custom code to create the volumes and then the Drishti volume rendering software for the final graphics. The rendering technique is traditional volume rendering which includes assignment of both colour and opacity dependent on the voxel scalar quantity and also the estimate of local gradient to create a surface for the a lighting model. 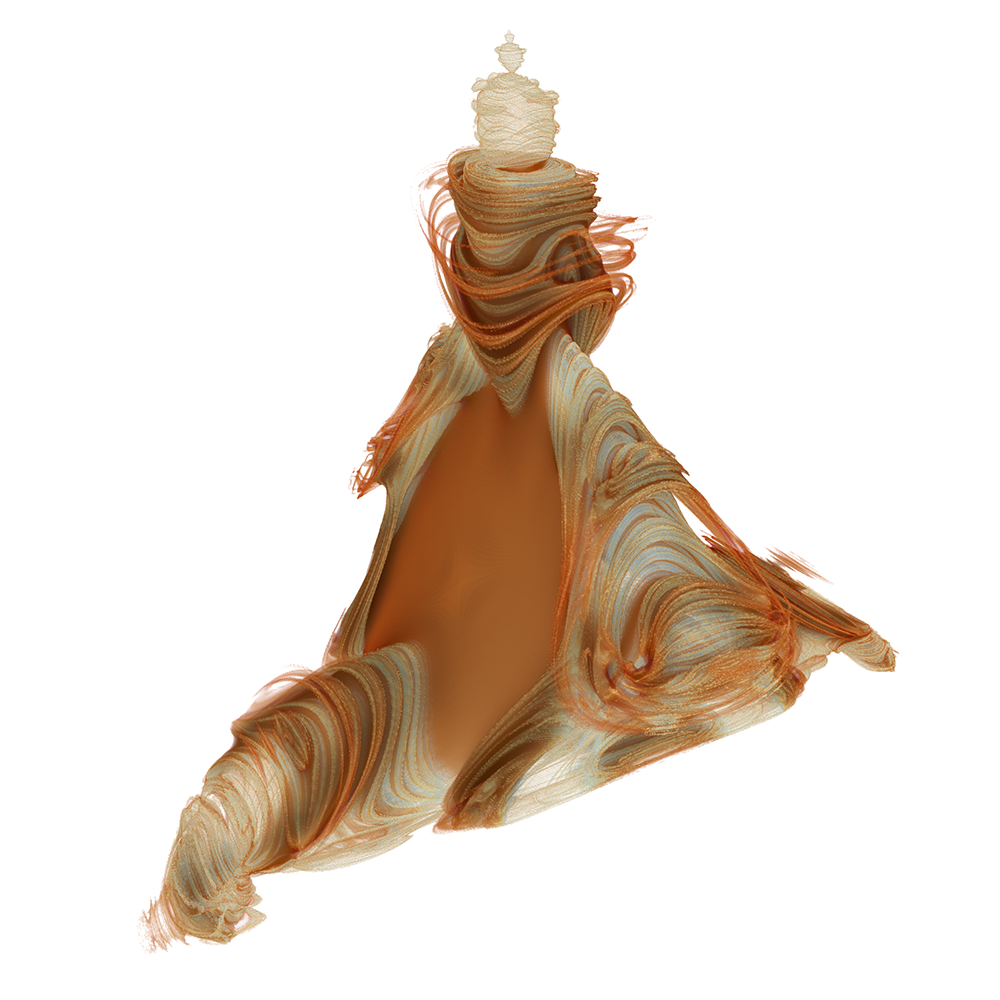
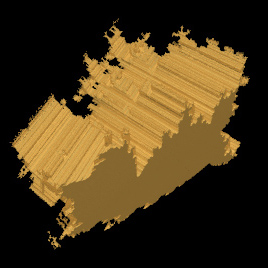
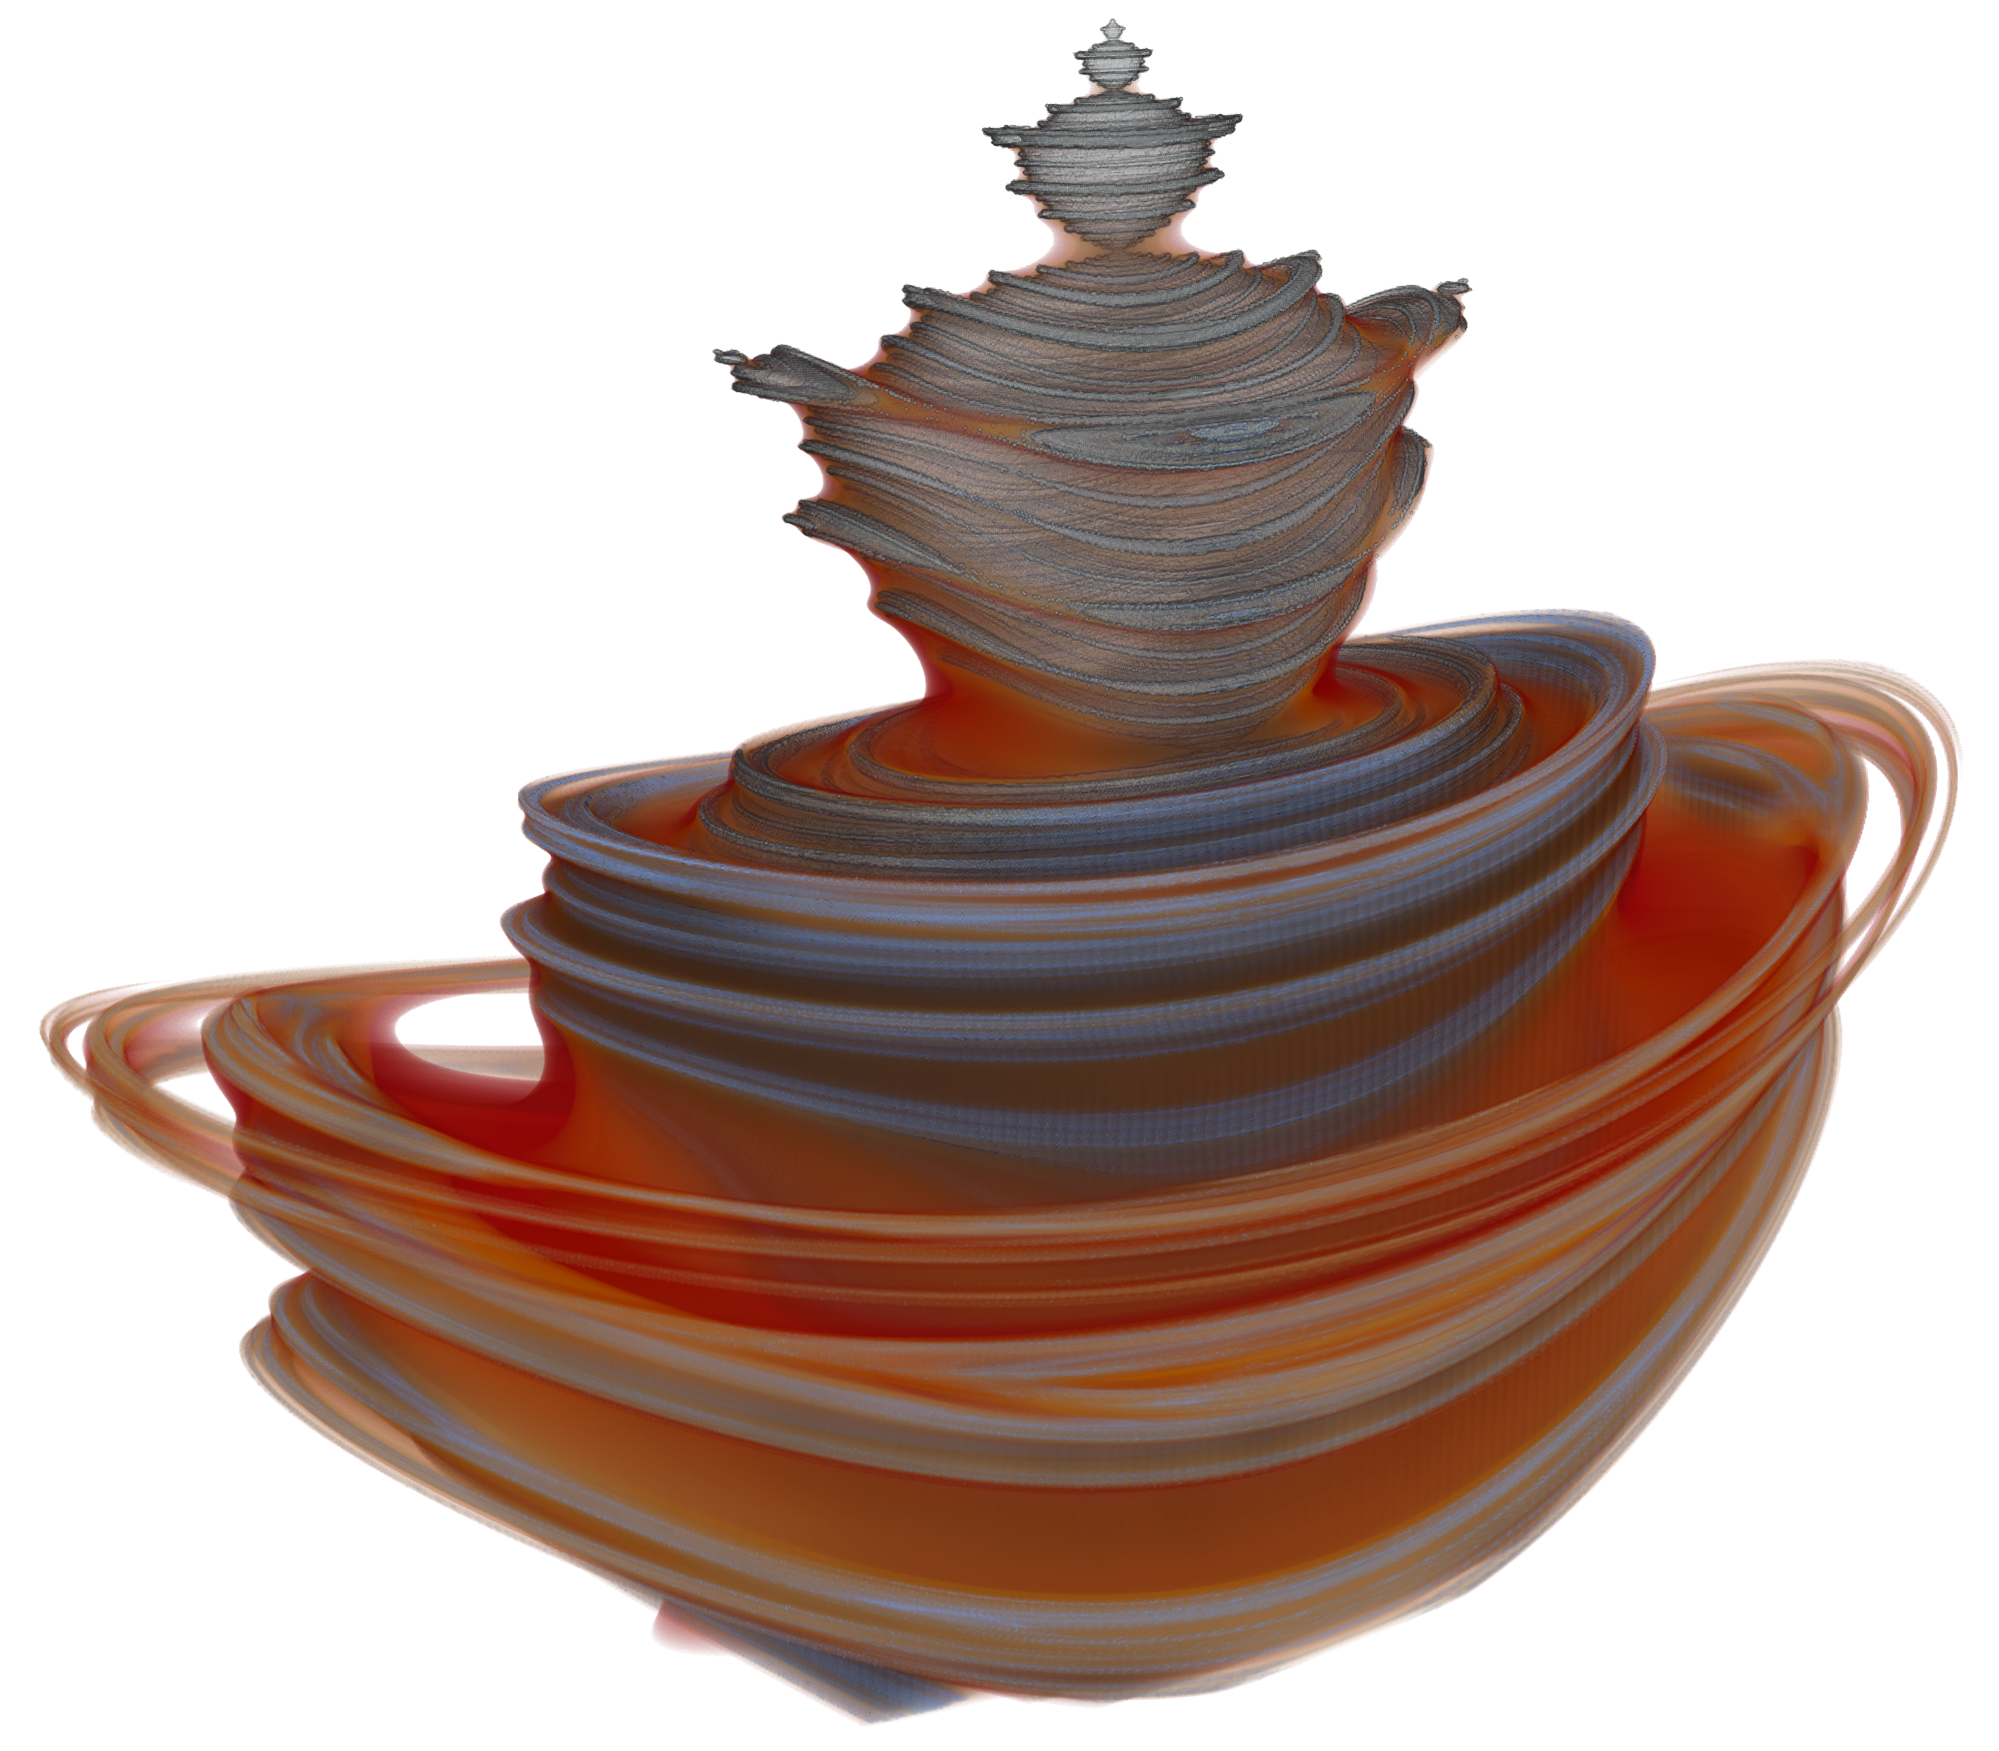
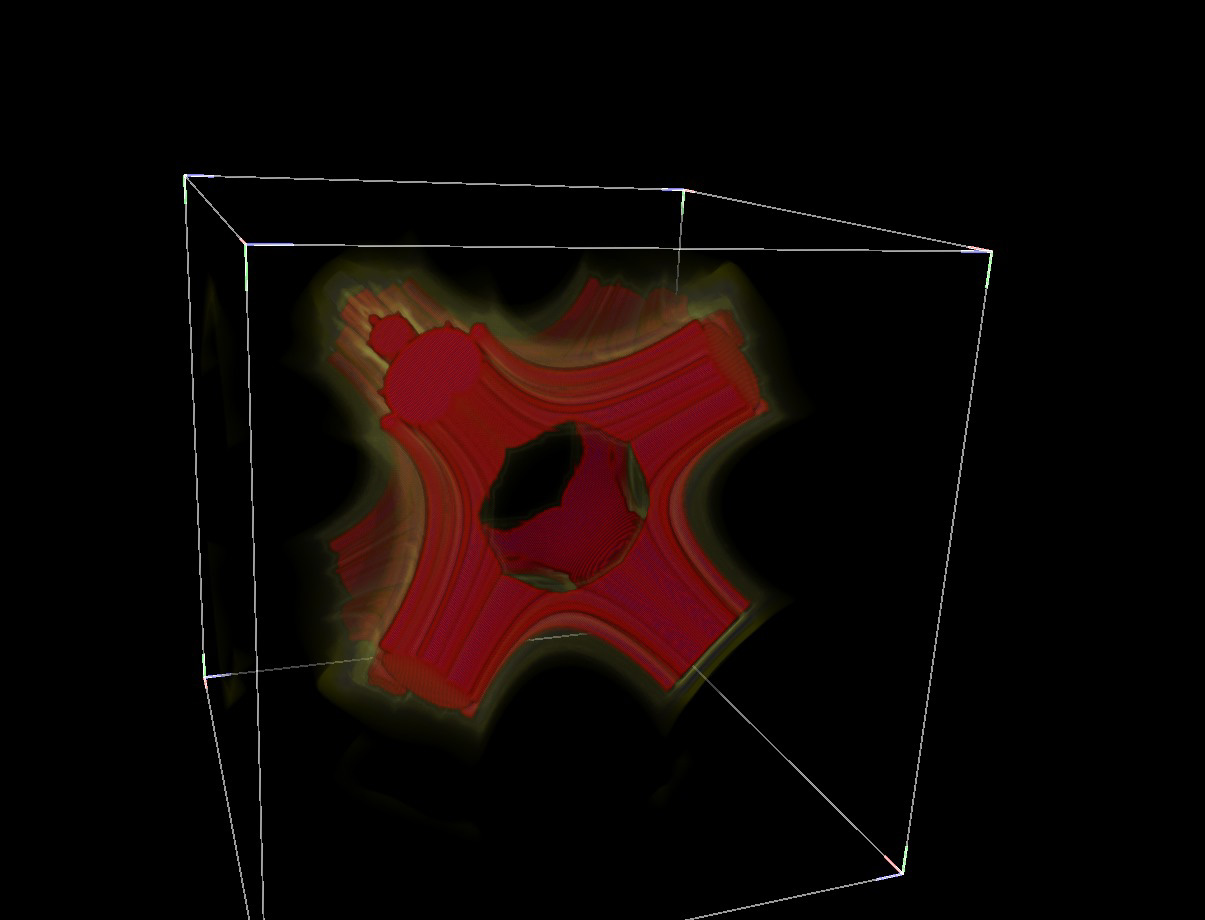
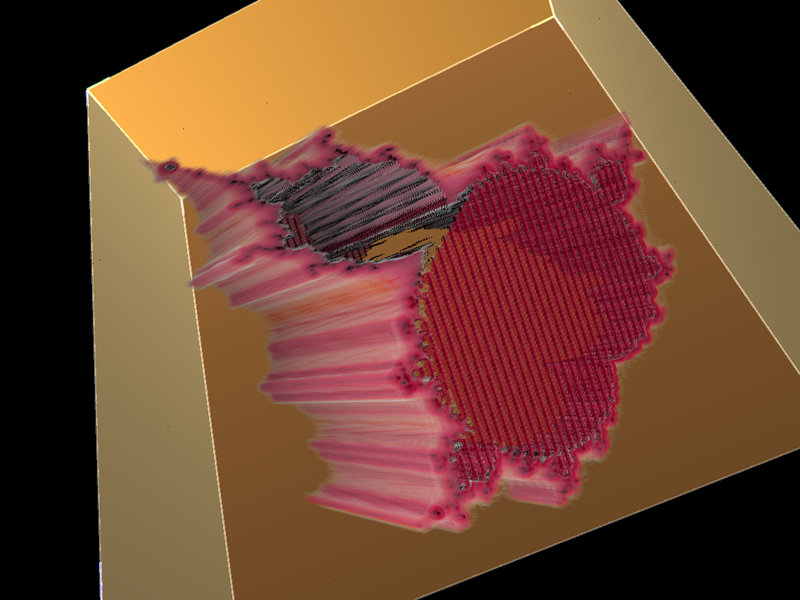
The range for which the interesting part of the model exists is -1.5 to 1.5 on all three axes. The first three renders here sample that volume 1024 times on each axis between the bounds above, so approximately 340 samples per unit distance. 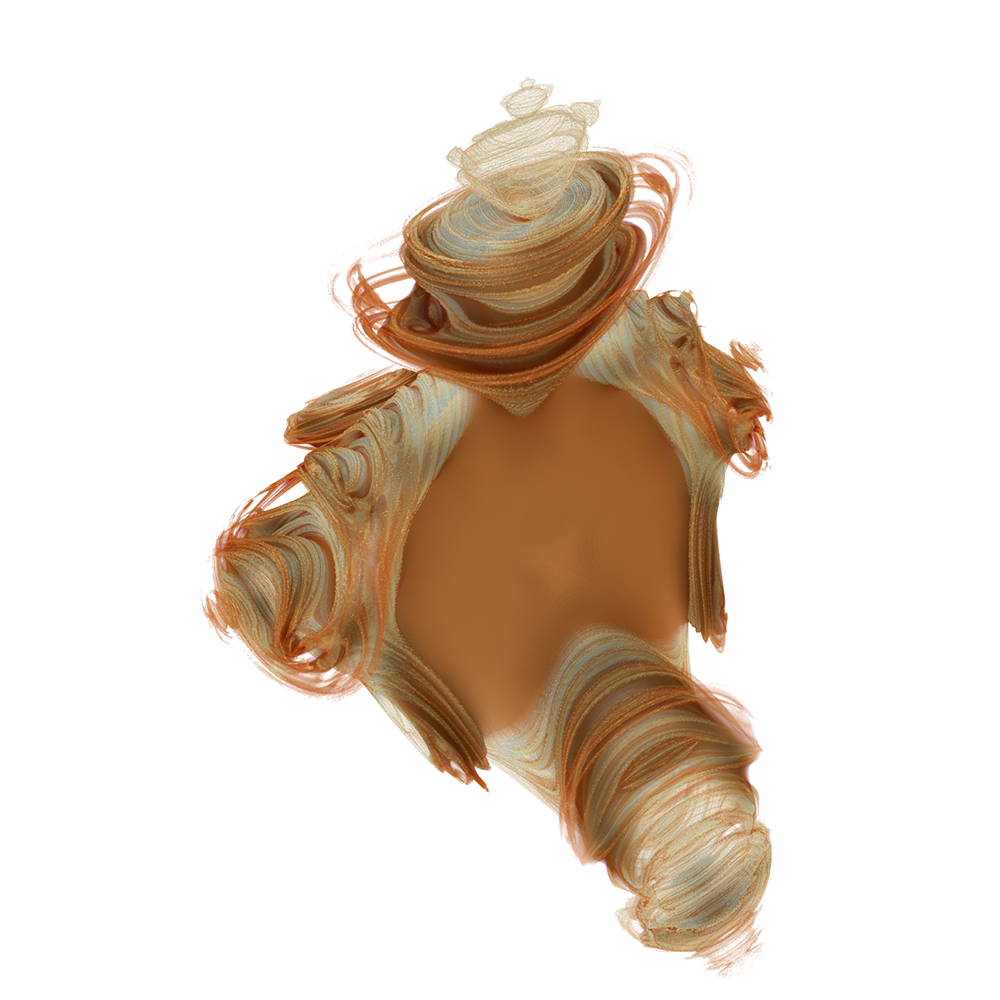
The next 2 images are a further 3 times zoom factor, namely 1000 sample per unit distance. 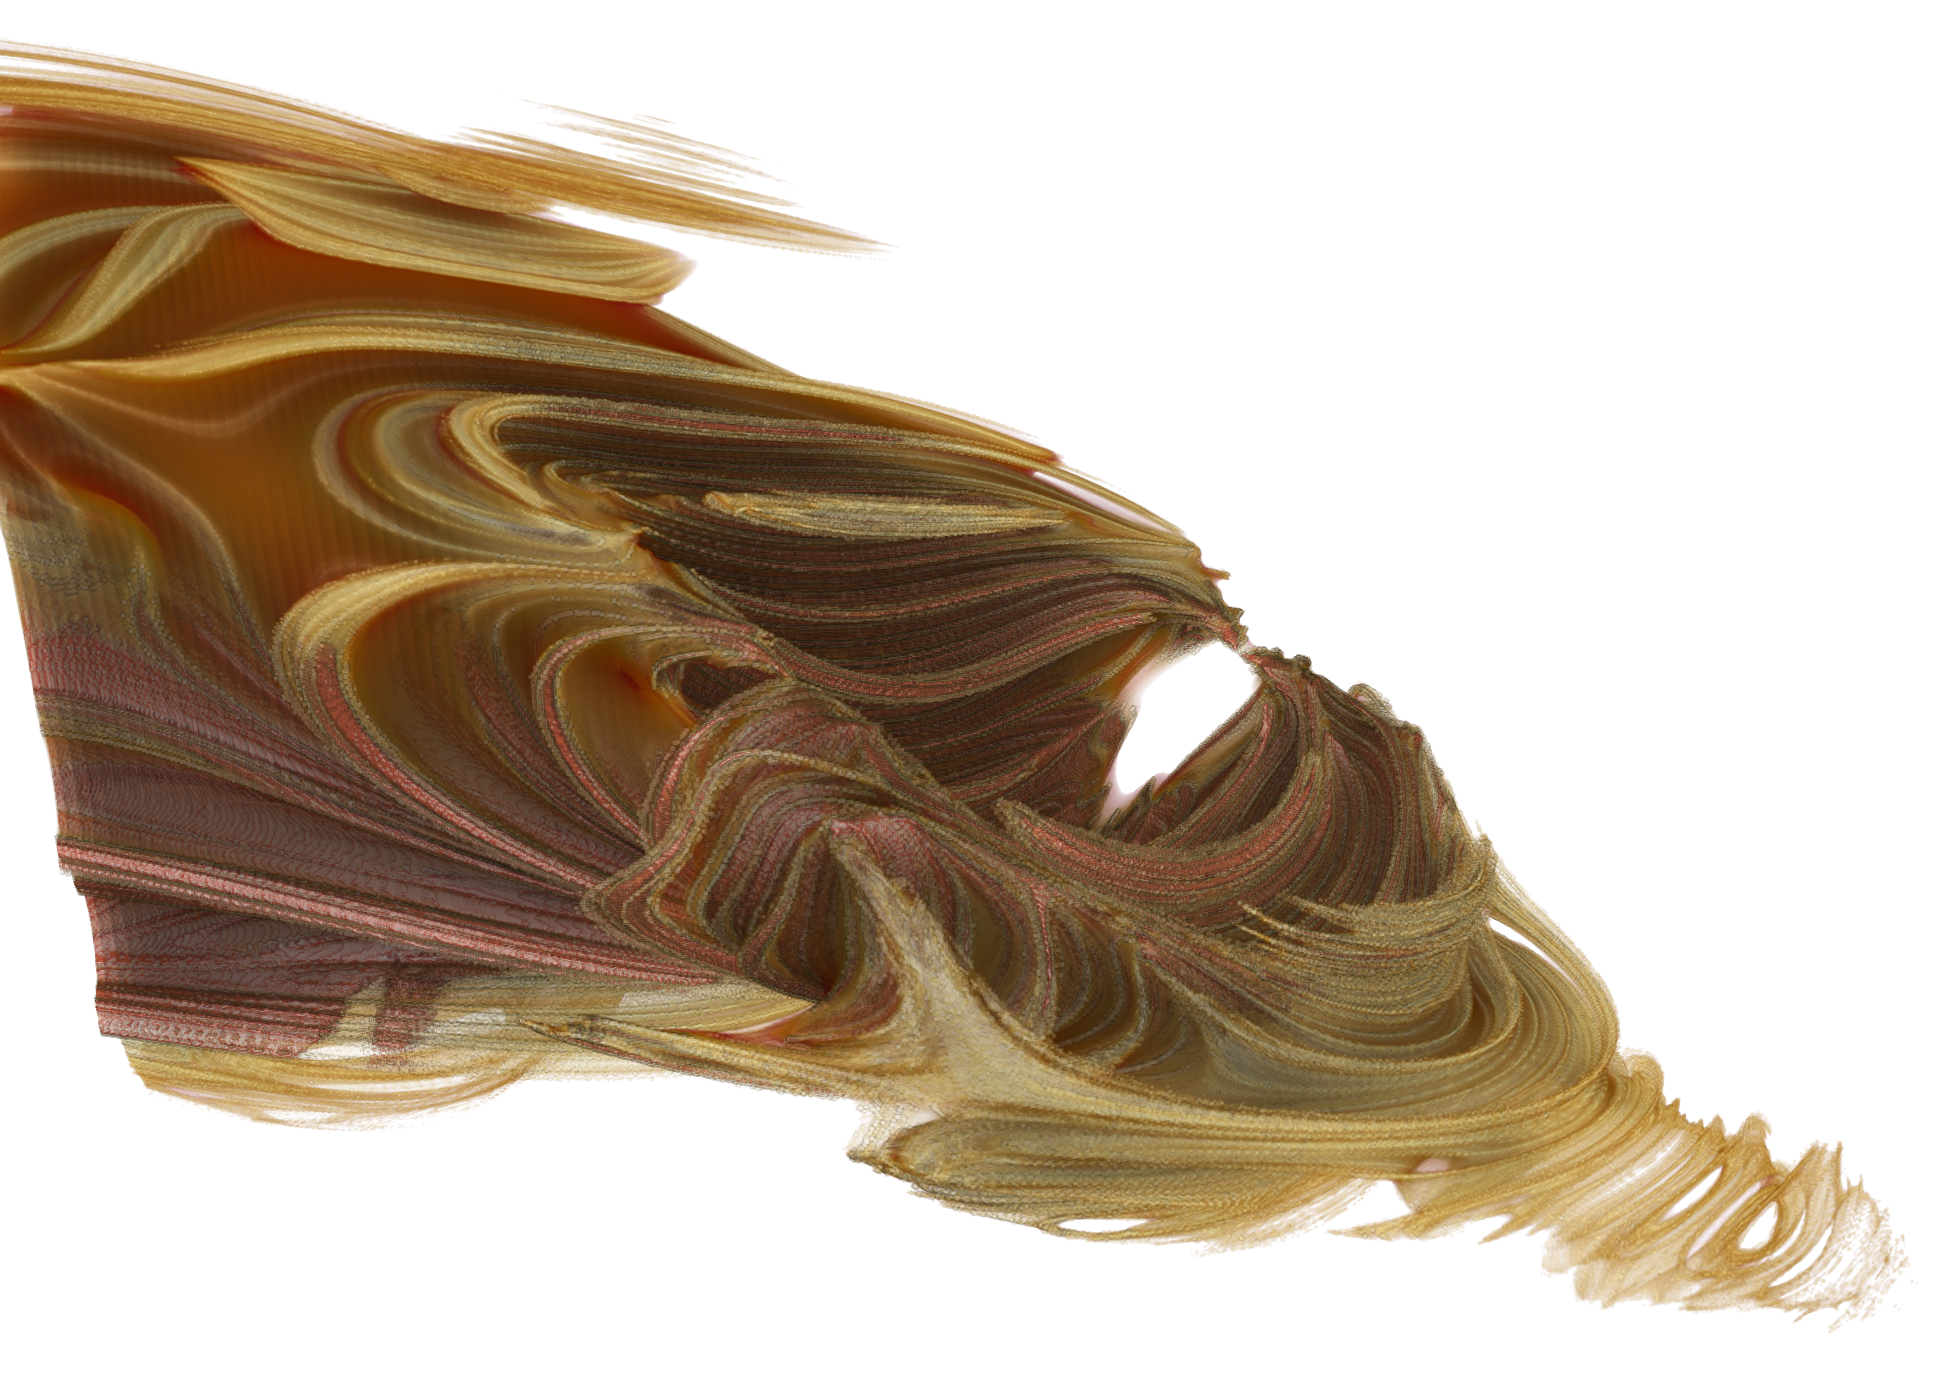
Real number MSetAttributed to Russell WalsmithWritten by Paul Bourke November 2006
QuinternionsAttributed to Russell WalsmithWritten by Paul Bourke August 2005
The images shown here are based upon quinternion arithmetic and are created in a similar way to the Mandelbrot set. That is, a function is iterated with some dependency on a position on the complex plane. The outcome of the series (infinity, zero, or otherwise) determines the state of that position and ultimately how it is represented graphically. Generally the distinction is made between the series tending to zero (inside the set) and other behaviour (outside the set). The difference here is the function being iterated is not in the complex plane but rather in five dimensions. To determine whether the position in 5D is inside or outside the set, a test is made whether the magnitude of the series (a 5 dimensional vector) tends to zero. The result, as shown in the images on the right is a Mandelbrot like outline, extruded in 3D space over some limited range. In these image the first three dimensions are mapped to 3D Cartesian coordinates and the last two dimensions are fixed at one value, a point in the plane of the last two dimensions. The series in five dimensions is given byxn+1 = a + x0 yn+1 = b + y0 zn+1 = c + z0 un+1 = d + u0 vn+1 = e + v0 where a = xn2 + 2 (ynvn + znun) b = un2 + 2 (xnyn + znvn) c = yn2 + 2 (xnzn + unvn) d = vn2 + 2 (xnun + ynzn) e = zn2 + 2 (xnvn + ynun) where (x0,y0,z0,u0,v0) is the point in question.
C style code to evaluate the quinternion
int Eval(double *q,int nmax)
{
   int i,n=0;
   double a[5],q1[5] = {0,0,0,0,0};
   double zz = 0;

   while (zz < 100 && n < nmax) {
      a[0] = q1[0]*q1[0]+2*(q1[1]*q1[4]+q1[2]*q1[3]);
      a[1] = q1[3]*q1[3]+2*(q1[0]*q1[1]+q1[2]*q1[4]);
      a[2] = q1[1]*q1[1]+2*(q1[0]*q1[2]+q1[3]*q1[4]);
      a[3] = q1[4]*q1[4]+2*(q1[0]*q1[3]+q1[1]*q1[2]);
      a[4] = q1[2]*q1[2]+2*(q1[0]*q1[4]+q1[1]*q1[3]);
      zz = 0;
      for (i=0;i<<5;i++) {
         q1[i] = a[i] + q[i];
         zz += q1[i] * q1[i];
      }
      n++;
   }

   return(n);
}
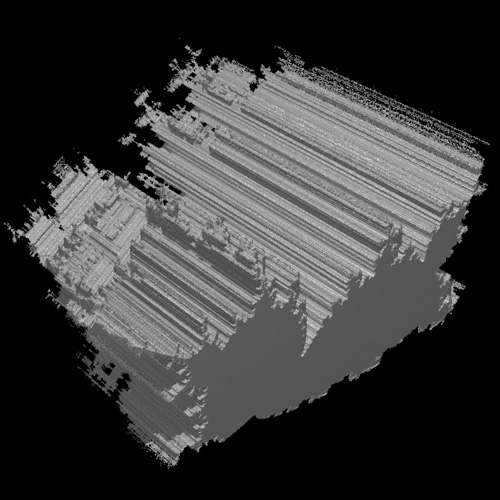
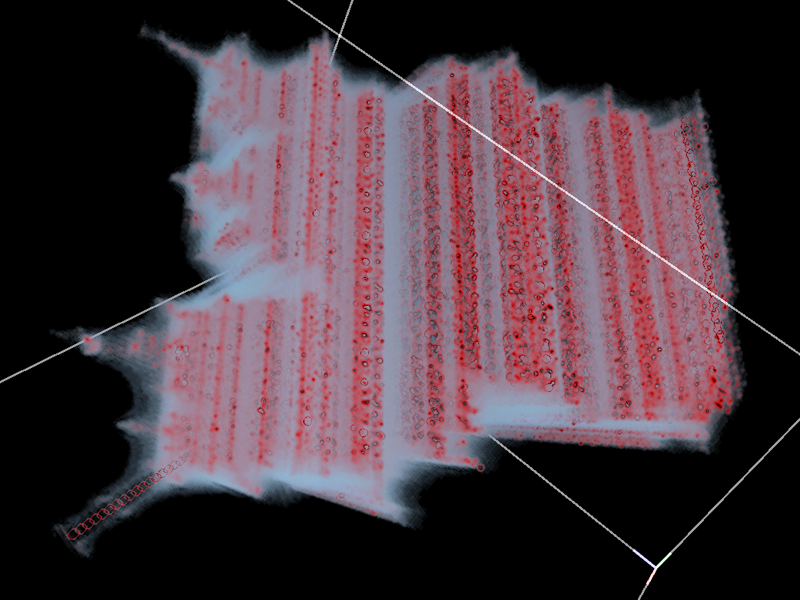
sine-msetCreated by Paul BourkeAttributed to Russell Walsmith January 2007
This is created by considering each point within some region of 3D space (x0,y0,z0) and evaluating the following series. The point (voxel in computer graphics language) is then shaded/coloured depending on how quickly the series tends to infinity. yn+1 = b + sin(y0) zn+1 = c + sin(z0) where
b = zn2 + 2 xn yn c = yn2 + 2 xn zn
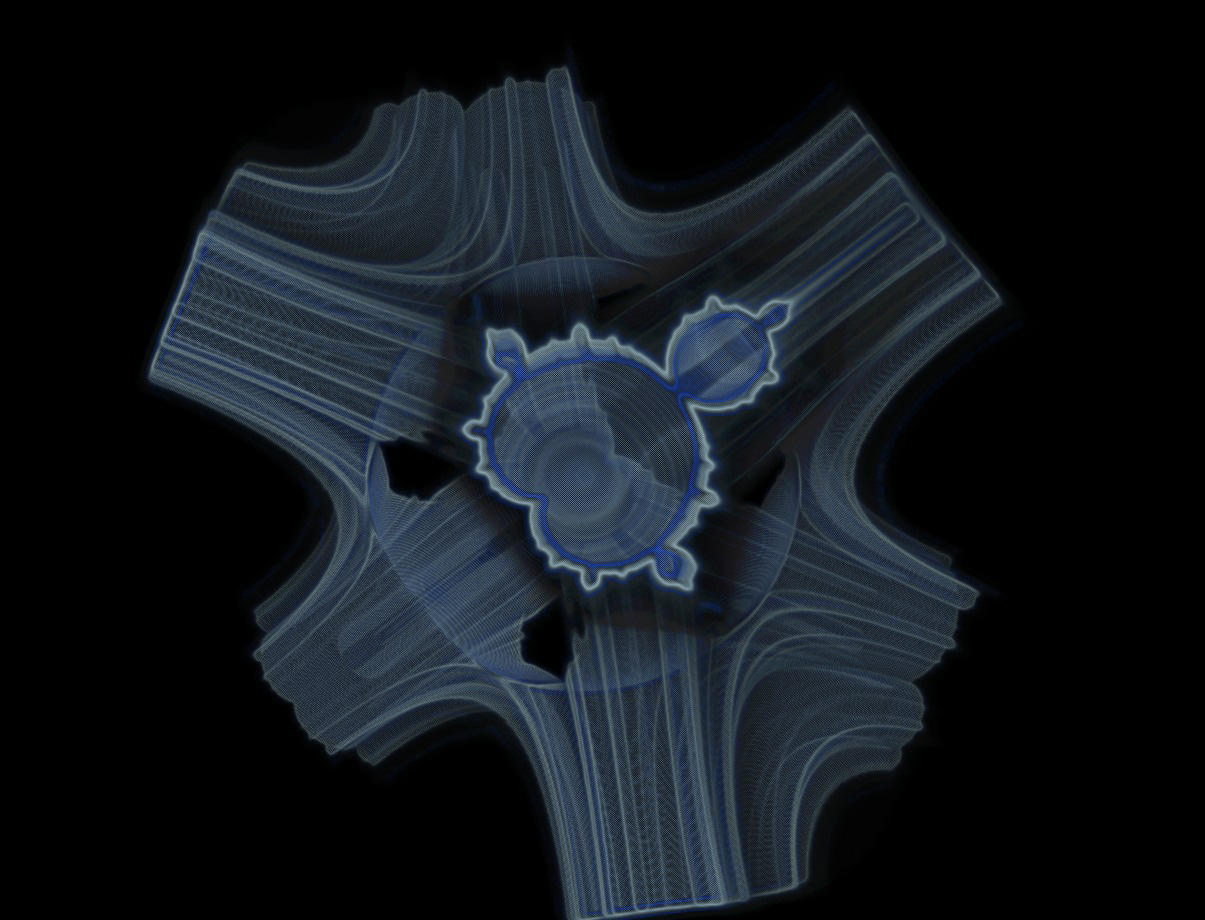
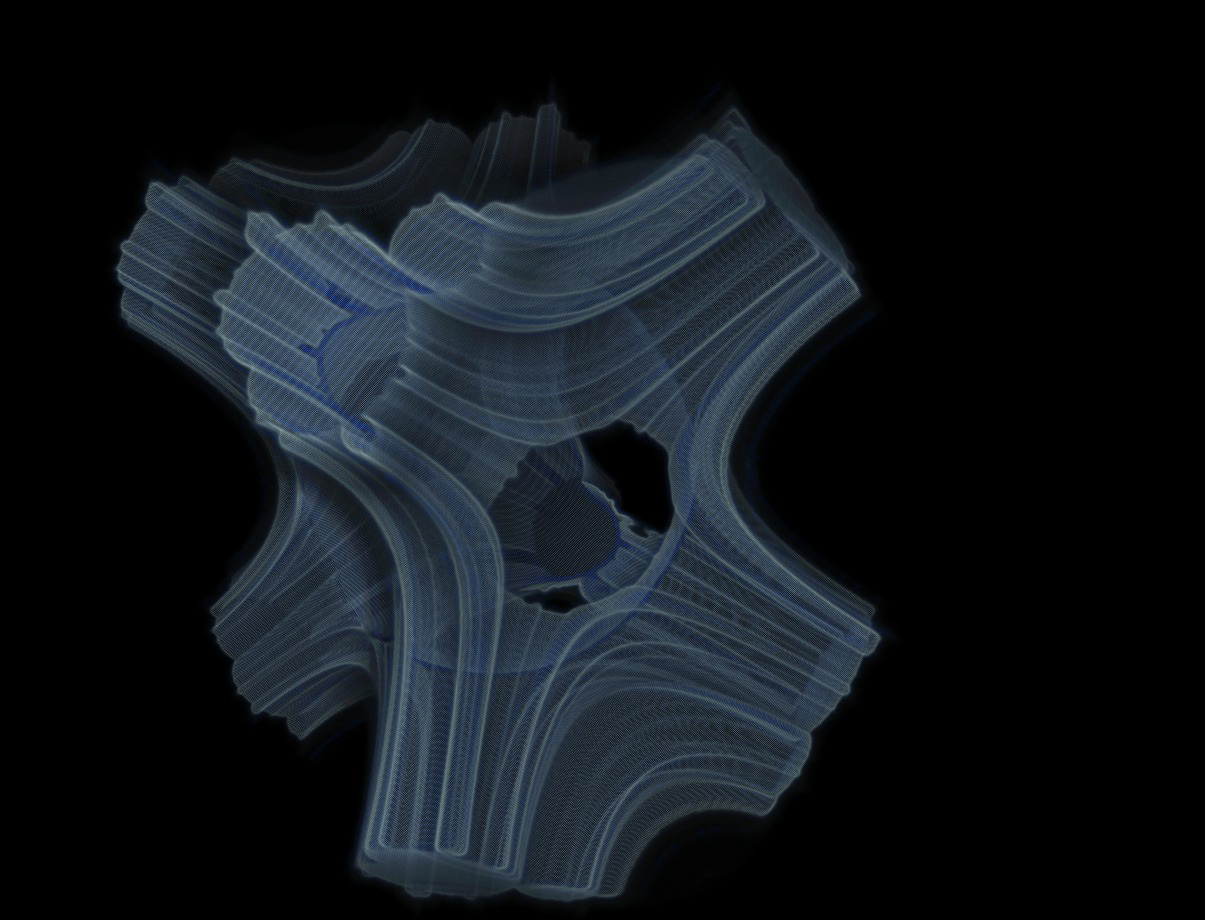
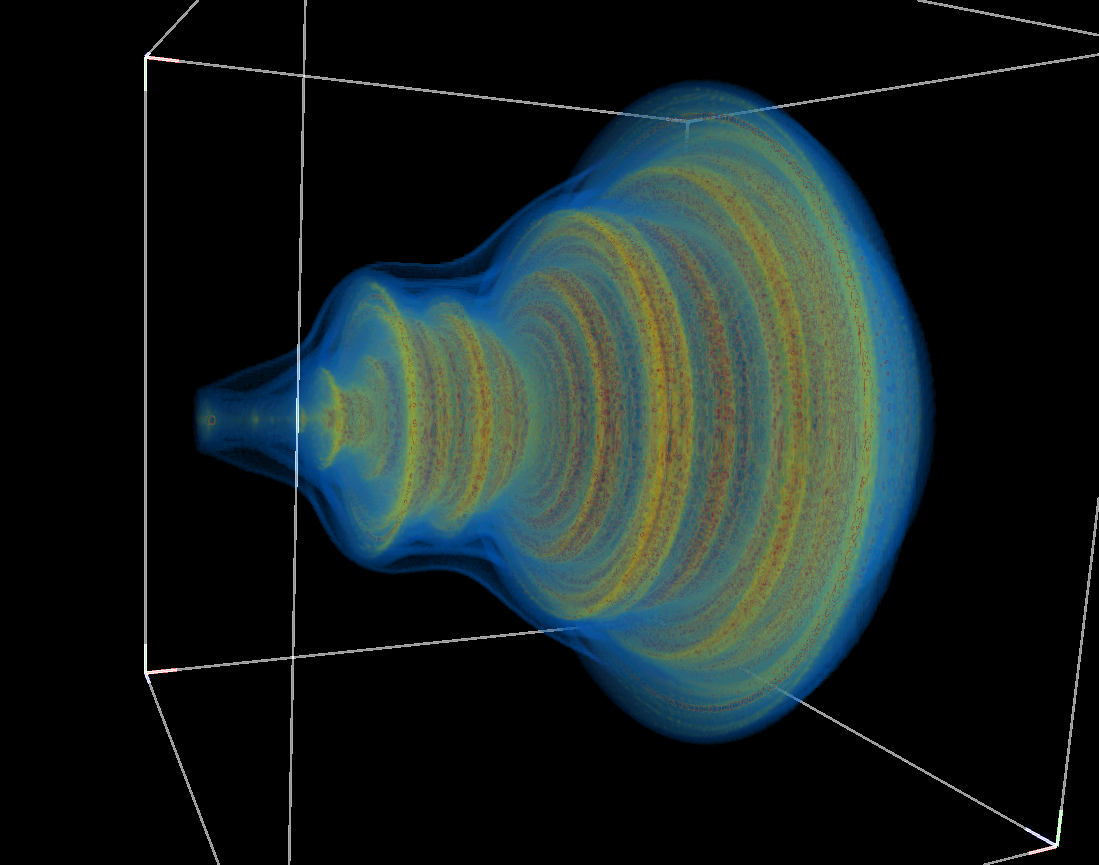
TriternionsAttributed to Russell WalsmithWritten by Paul Bourke August 2005, Update: Oct 2014
The images shown here are based upon triternion arithmetic and are created in a similar way to the Mandelbrot set. That is, a function is iterated with some dependency on a position on the complex plane. The outcome of the series (infinity, zero, or otherwise) determines the state of that position and ultimately how it is represented graphically. Generally the distinction is made between the series tending to zero (inside the set) and other behaviour (outside the set). 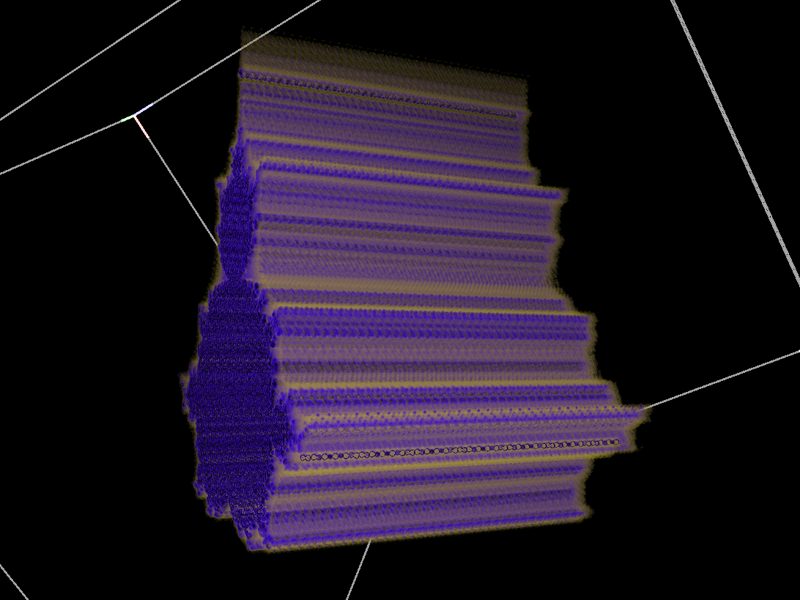
The difference here is the function being iterated is not in the complex plane but rather in three dimensions. To determine whether the position in 3D is inside or outside the set, a test is made whether the magnitude of the series (a vector) in 3D tends to zero. The result, as shown in the images is a Mandelbrot like outline, extruded in 3D space over some limited range. 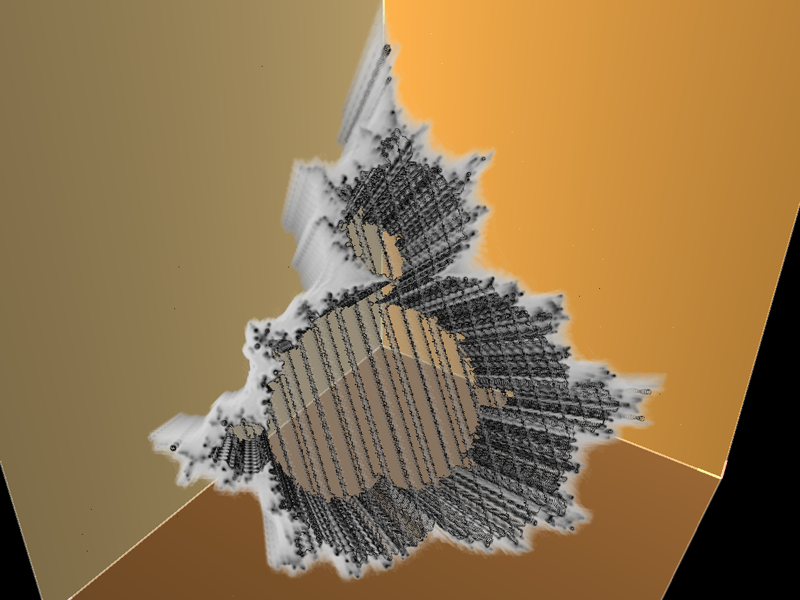
The series in three dimensions is given by
In the images shown here the bounds of the cube shown is -1.75 to 0.75 in each dimension. FracInt code by Russell Walsmith
; The reduced Tset formula
Frm4 {
   x=real(pixel), y=imag(pixel), z=p1
   x1=y1=z1=0:
   a = x1^2 + 2*y1*z1
   b = z1^2 + 2*x1*y1
   c = y1^2 + 2*x1*z1
   x1 = a+x, y1 = b+y, z1 = c+z
   s = x1^2 + y1^2 + v1^2
   s < 100
}
C style code to evaluate the triternion
int Eval(double x,double y,double z,int nmax)
{
   int n = 0;
   double x1 = 0,y1 = 0,z1 = 0;
   double a,b,c;
   double zz = 0;

   while (zz < 100 && n < nmax) {
      a = x1*x1 + 2*y1*z1;
      b = z1*z1 + 2*x1*y1;
      c = y1*y1 + 2*x1*z1;
      x1 = a + x;
      y1 = b + y;
      z1 = c + z;
      zz = x1*x1 + y1*y1 + z1*z1;
      n++;
   }

   return(n);
}
Code to create a volume suitable for rendering with the Drishti volume visualisation software, although any volume rendering package could be used: triternion.c 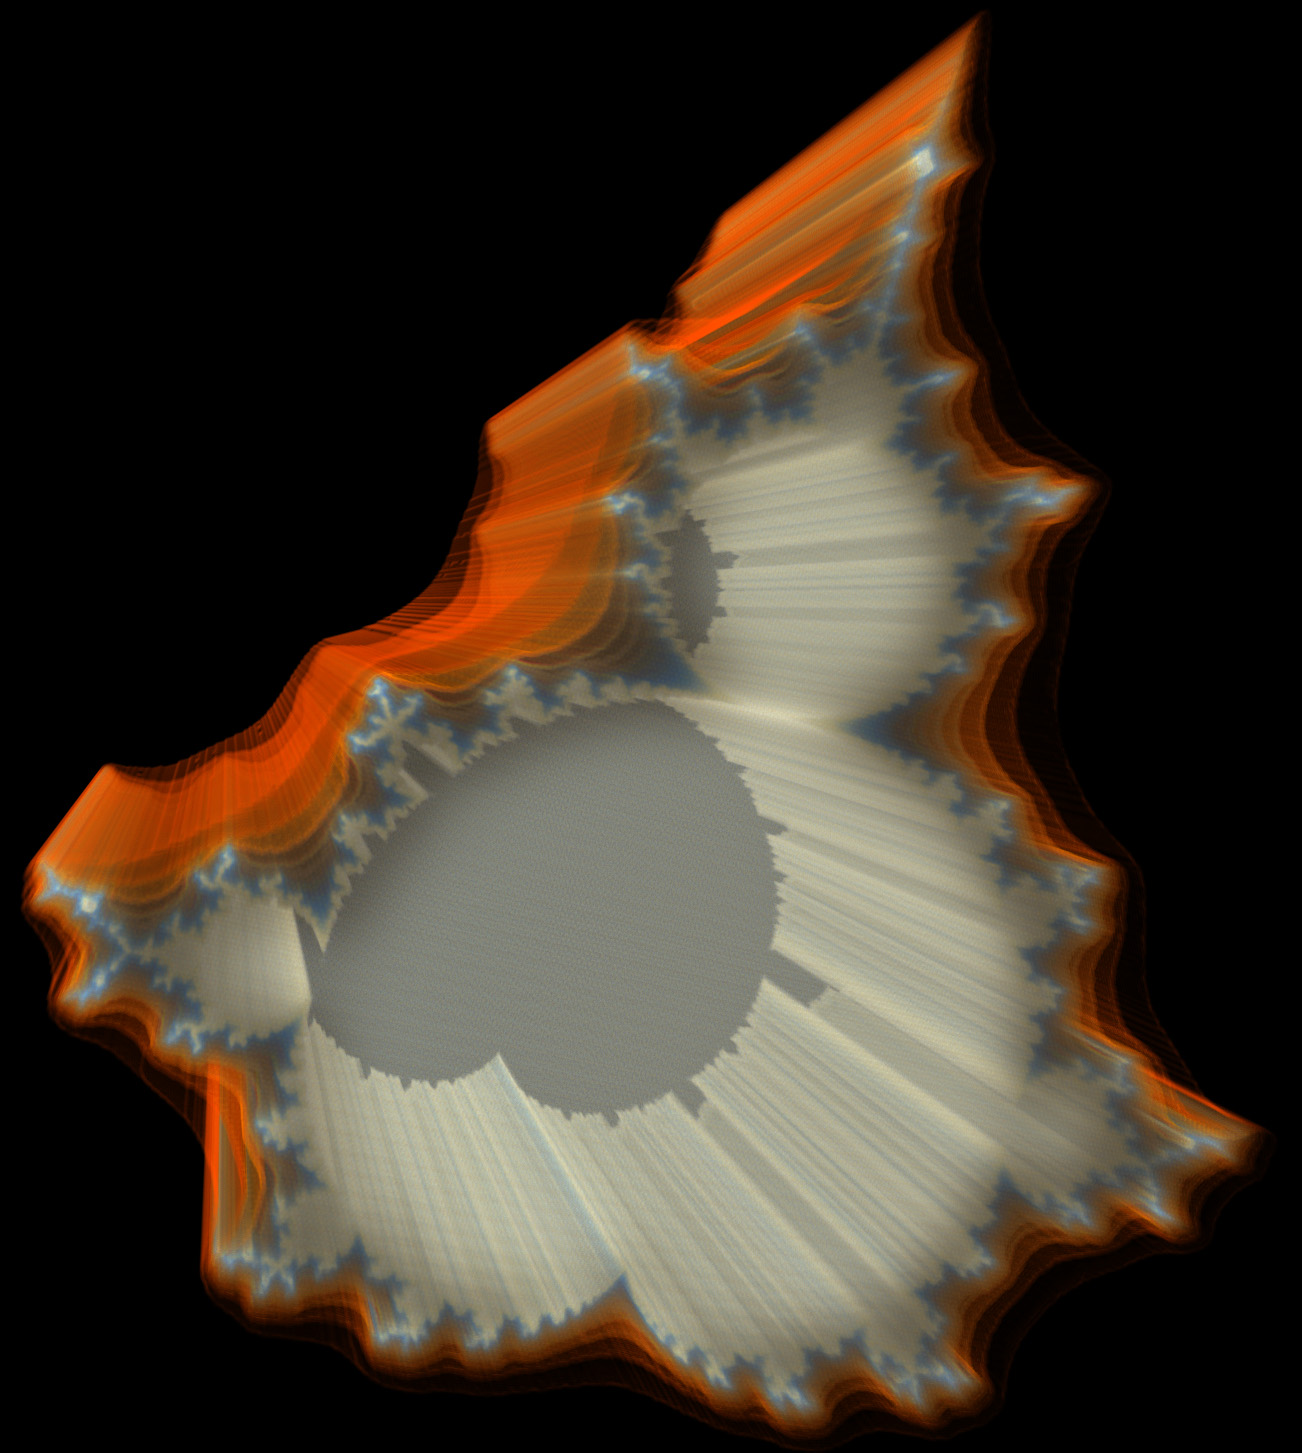
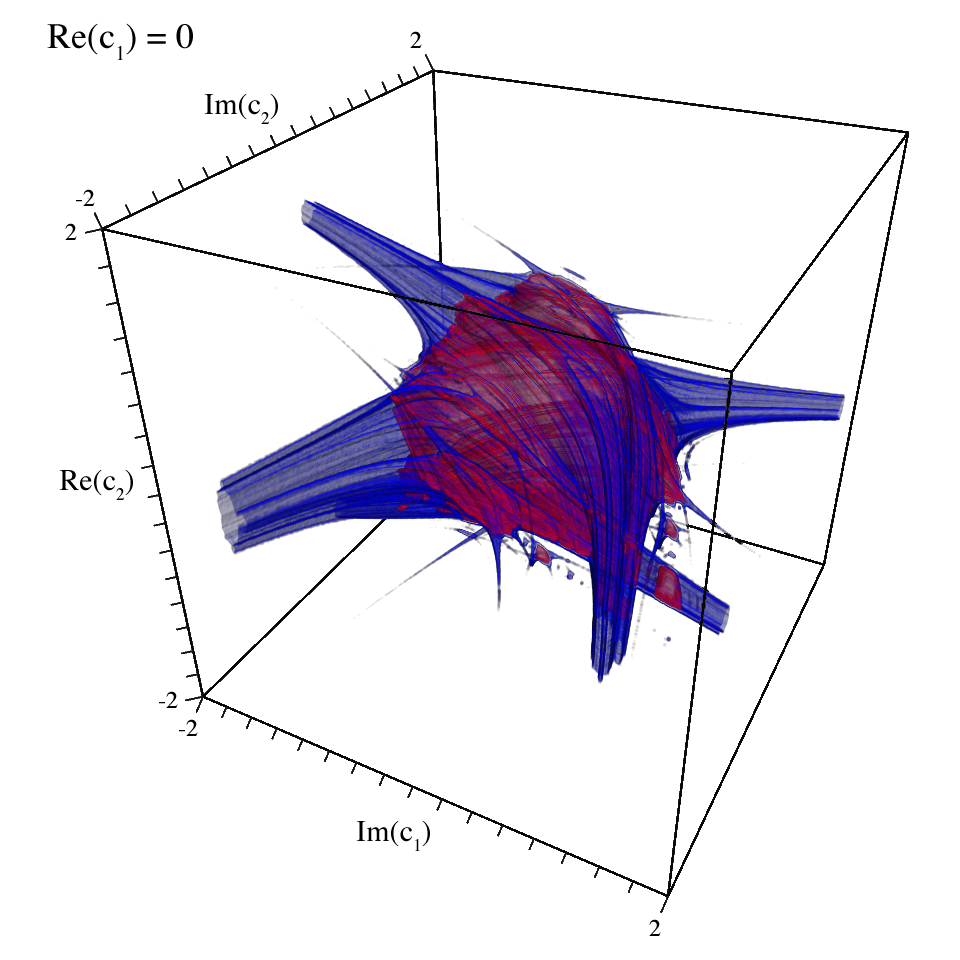
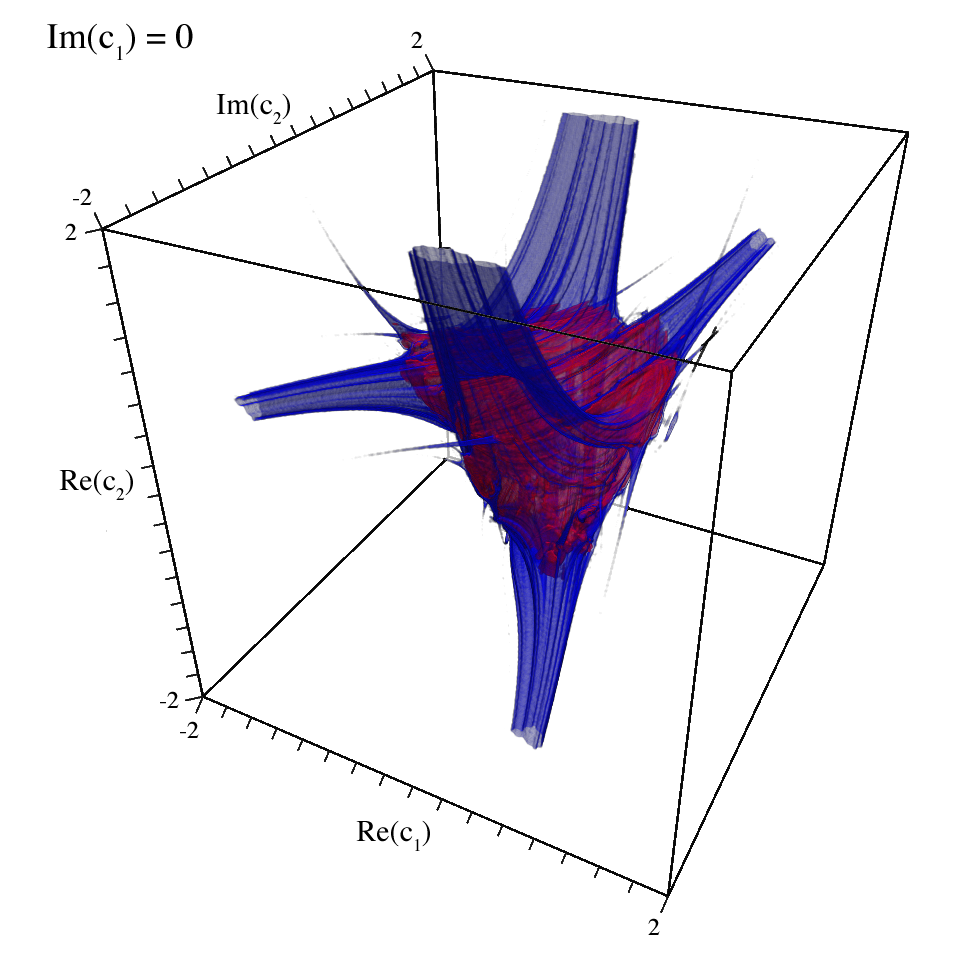
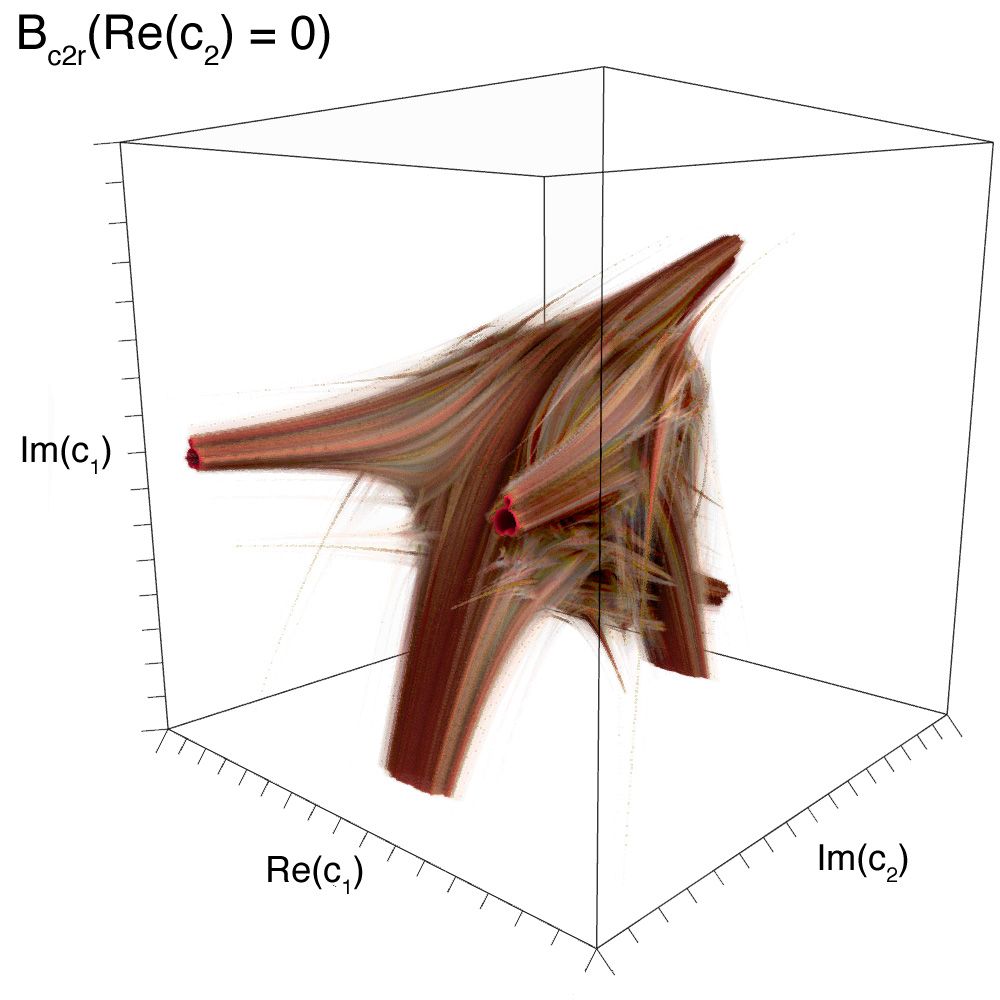
Danca FractalWritten by Paul BourkeIn conjunction with Marius-F Danca. March 2008 See also: Visualising volumetric fractals
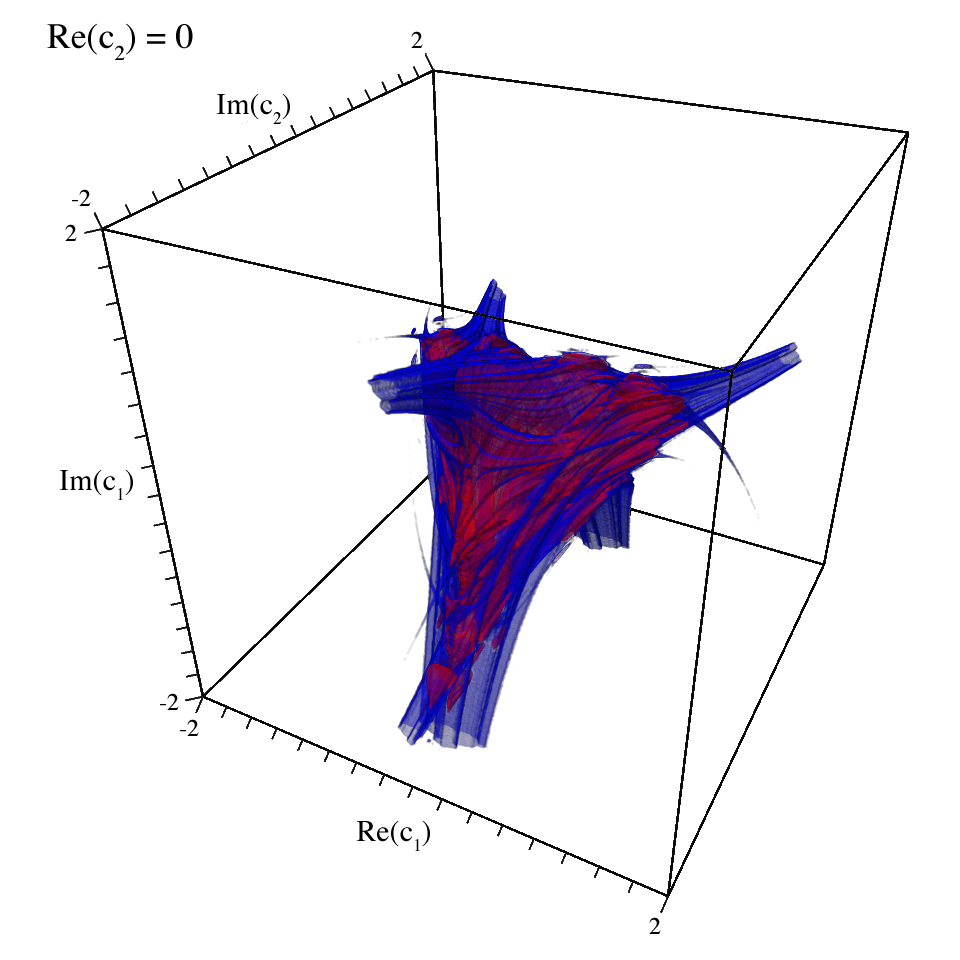
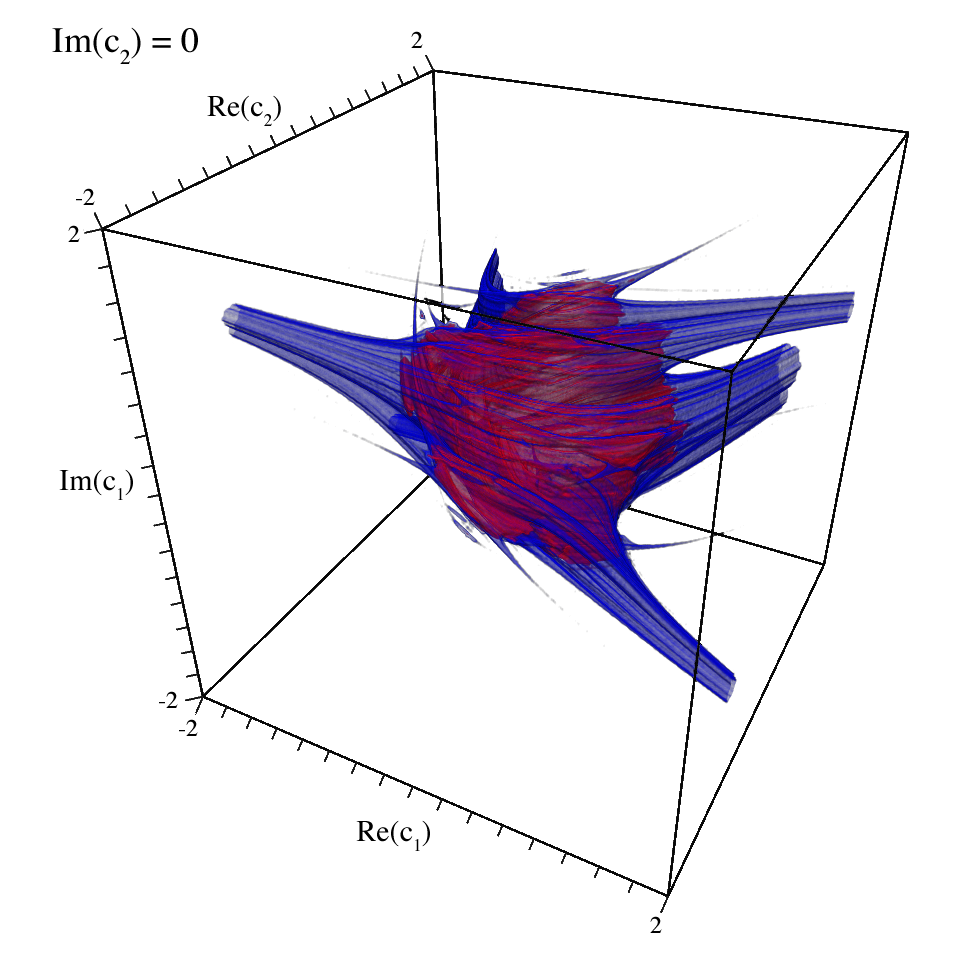
The following images/visualisation are explorations of the series below, where z, c1, and c2 are all complex.
Connectedness of Julia sets 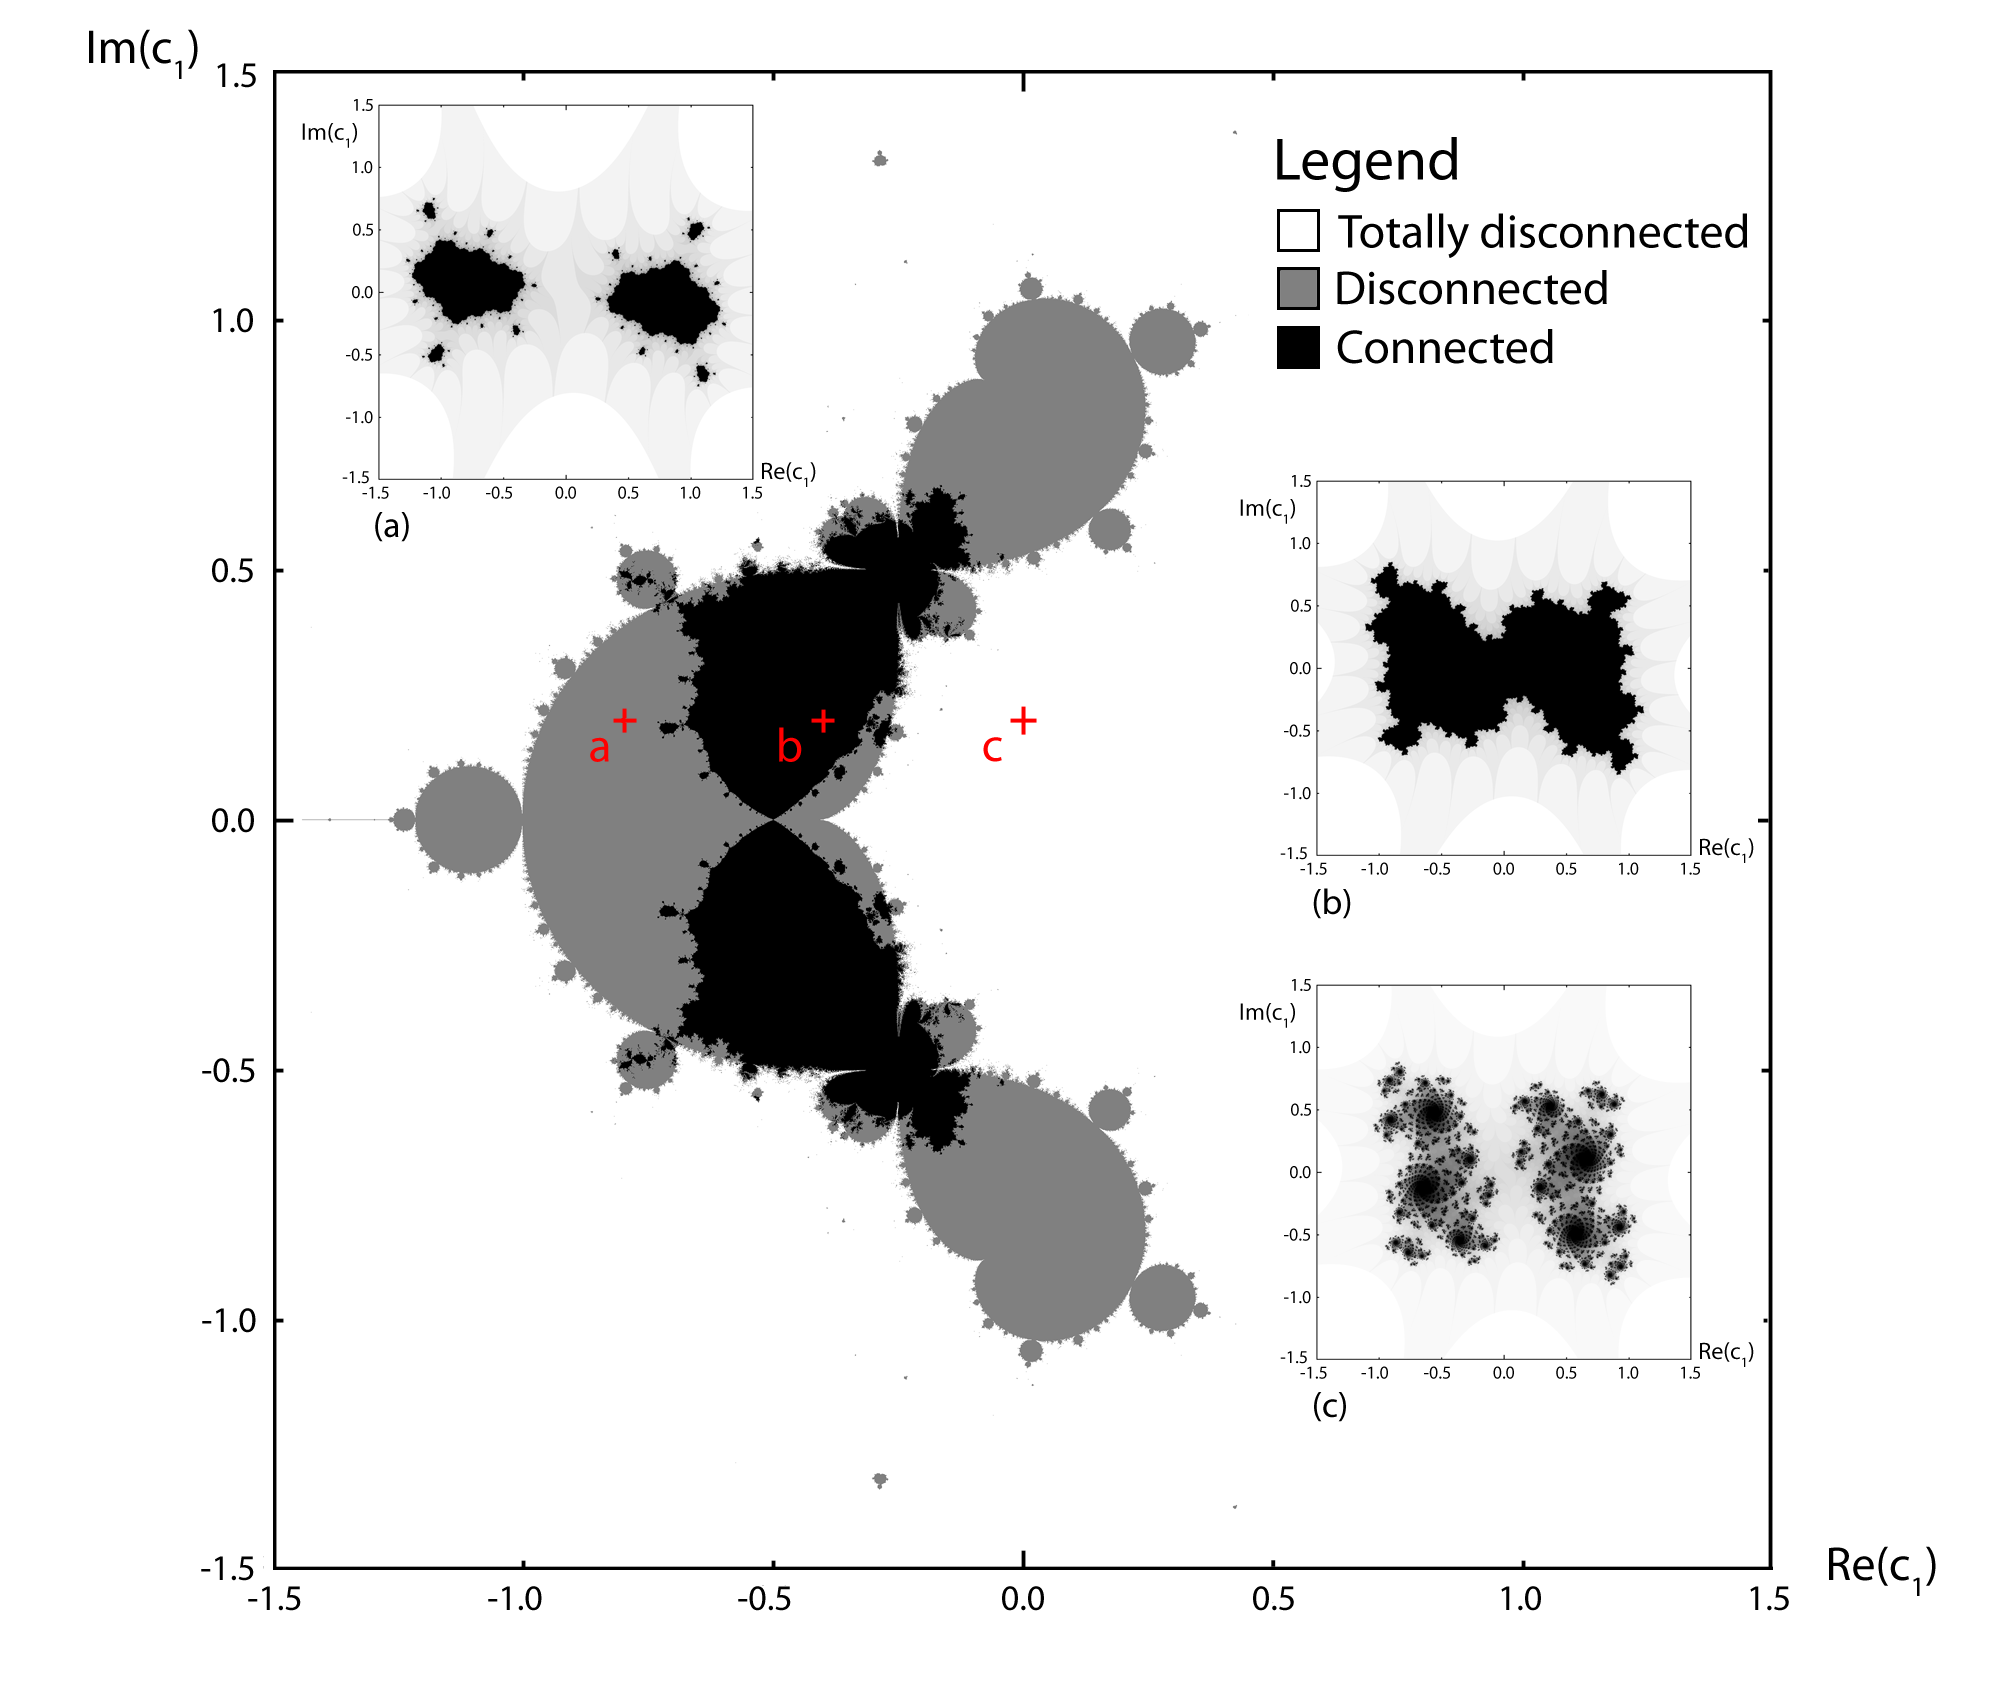
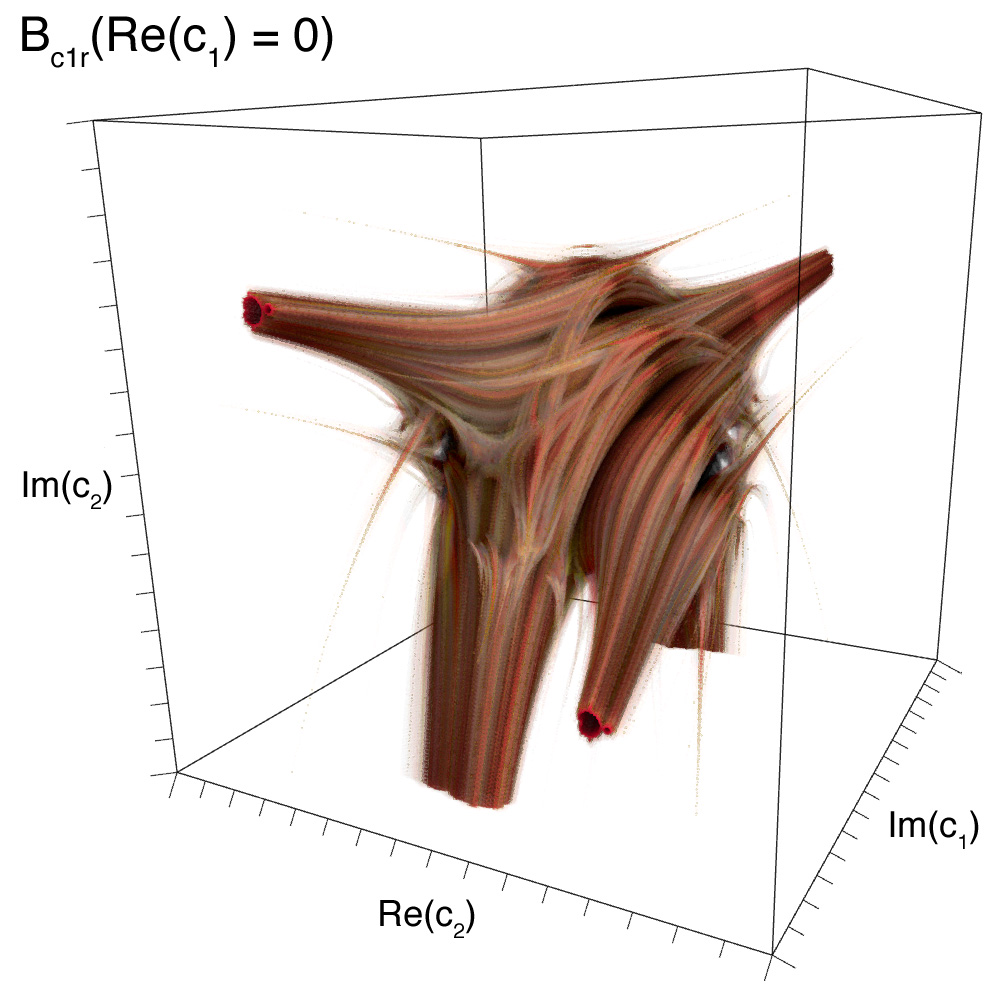
3D forms resulting from slices of the 4D space by each axis plane (at the origin)
Plane slices through each of the above 3D forms Other images
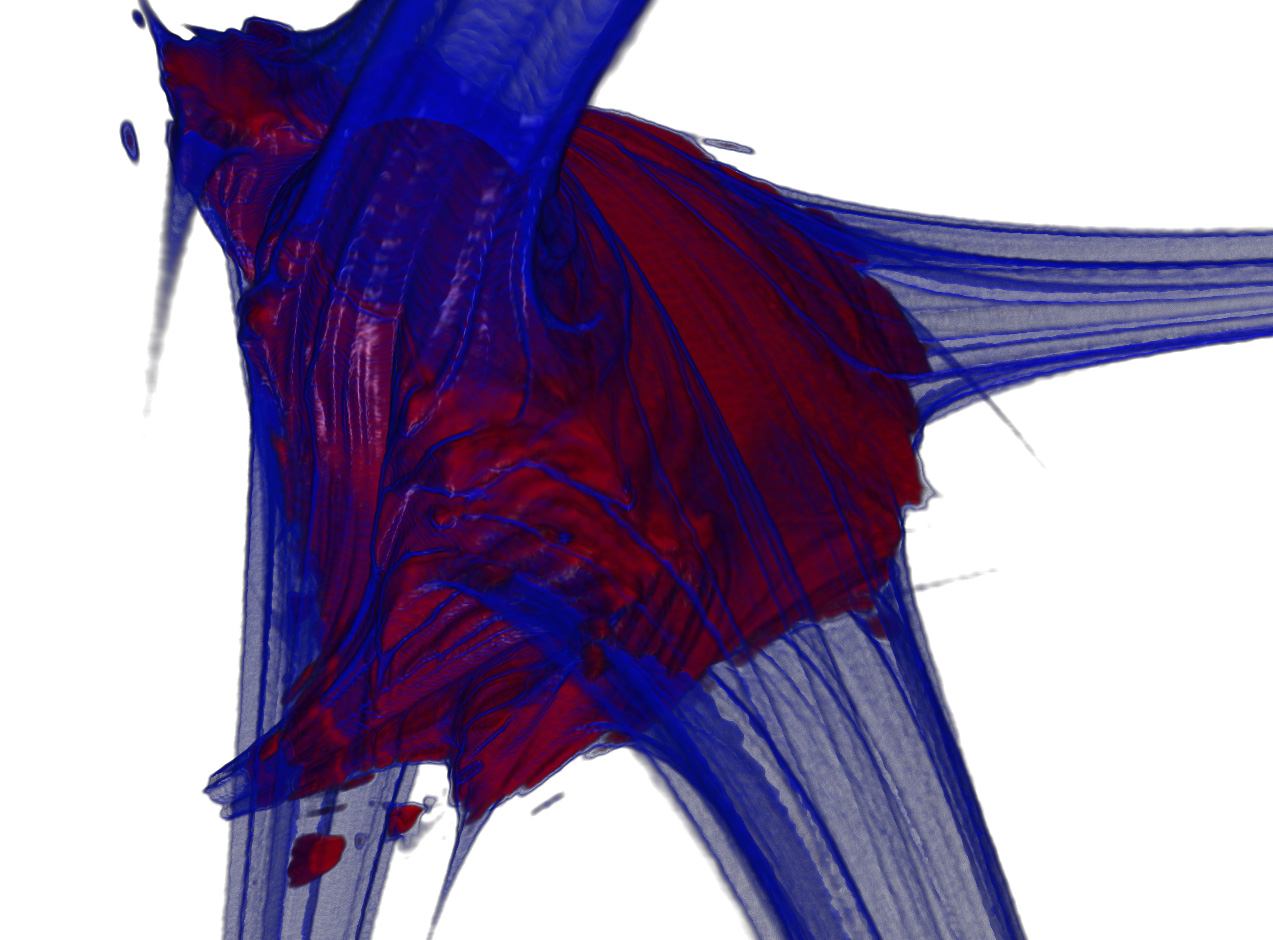
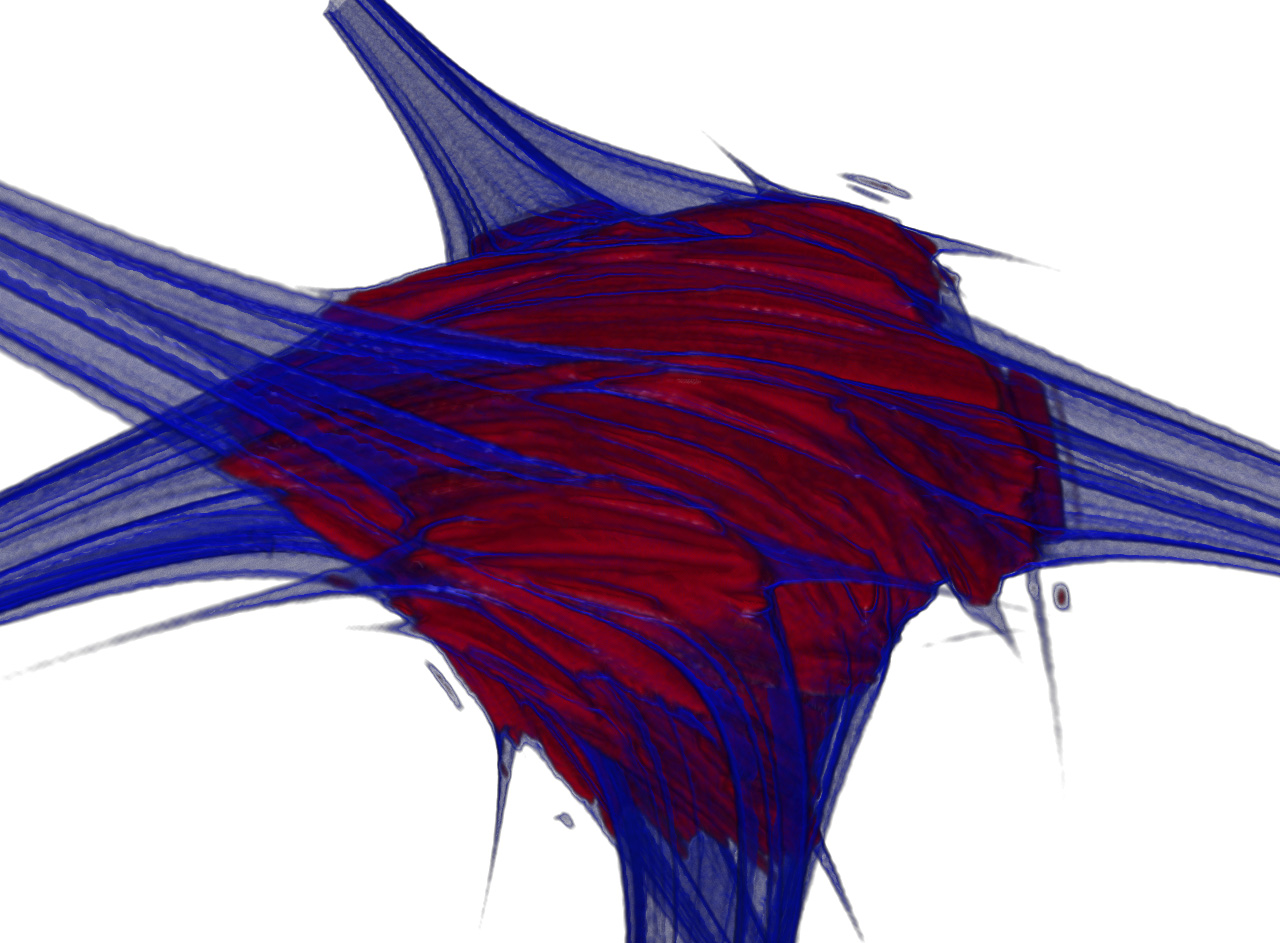
Slices through 3D section 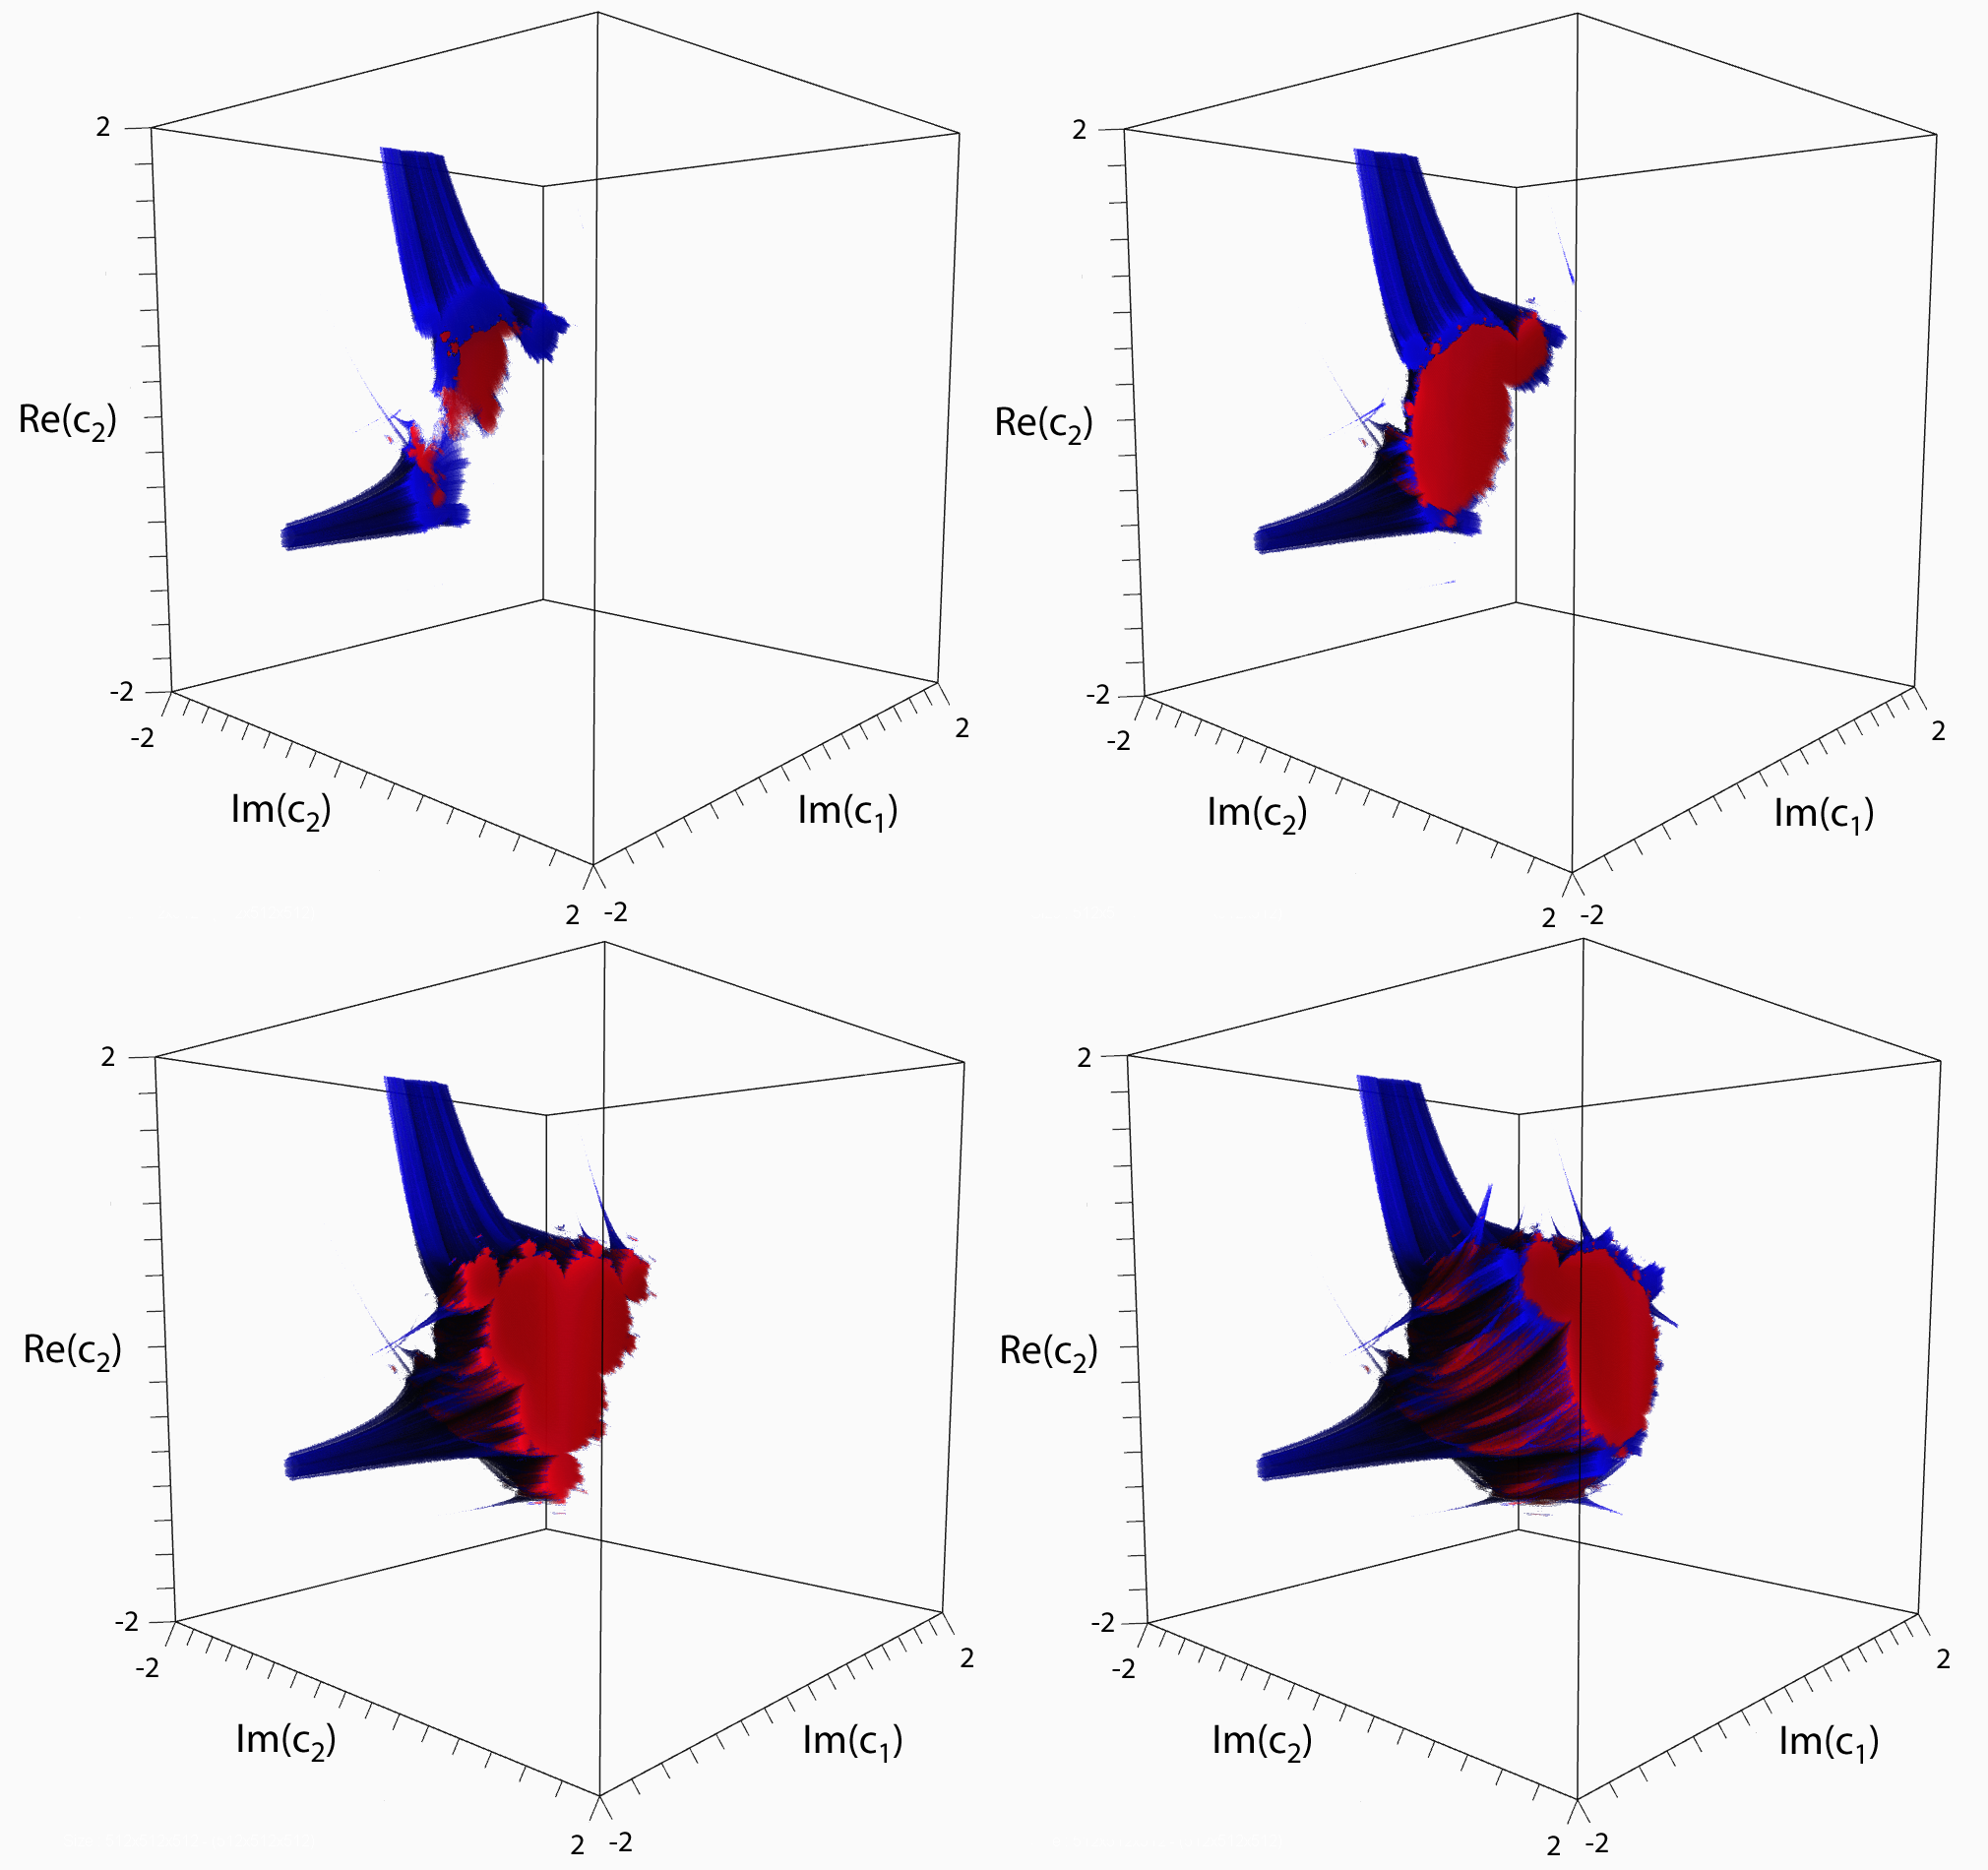
|