PVIEW
Real-time interactive visualisation for large point datasets
Developed by Stuart Gill
Initial design by Paul Bourke, 2004
Support by the AUC (Apple University Consortium)
|
|
Many areas of computational science involve large systems of particles that
undergo non-linear interactions. A key to gaining an intuitive feel for the
results is the ability to visually explore the data. This is particularly
true of cosmological N-body simulations that study the evolution of
structure in the Universe.
|
|
PVIEW the application is split into two parts:
- The core of PVIEW: the engine room
- The users plug-ins: allowing flexibility for the user to include their own code.
The examples here describe the core functionality of PVIEW.
Although this example uses cosmological simulation data,
PVIEW is general enough to be used to view and interact with
any point data set.
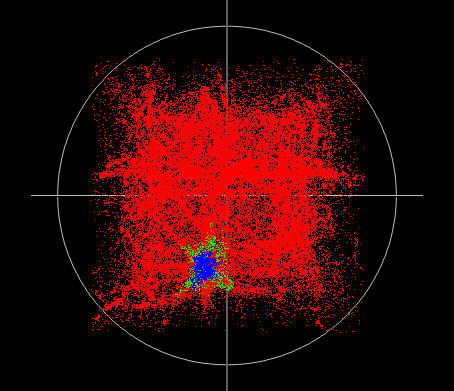
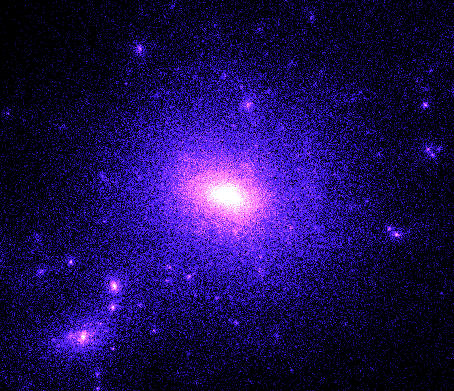
The following example is a 5 million particle re-simulation of a galaxy cluster.
The low resolution particles are in red; the intermediate in green and the
high resolution particles are in blue.
|
|
|
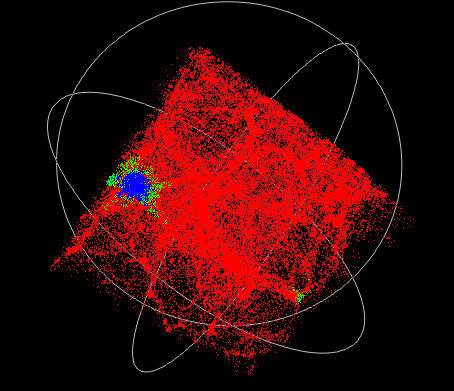
PVIEW supports real time interaction with this data set. The
sphere outline represents a clipping sphere that can be moved through the
data set, it's radius adjusted and all particles outside that sphere can be
clipped.
|
|
|
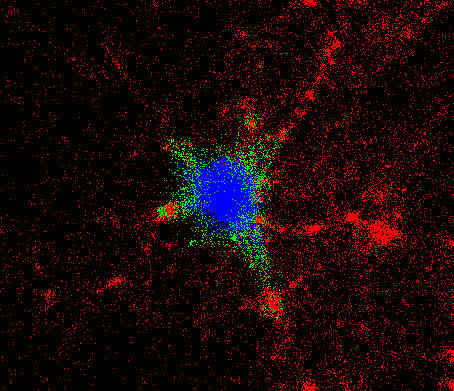
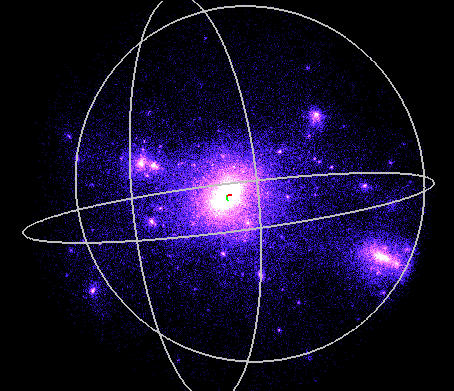
The graphics card can be used to calculate a line of sight density projection.
PVIEW has the ability to show the data at a number of
different levels of resolution. This is a further technique besides the
clipping sphere to enable clear and interactive exploration of those
parts of the dataset that are of interest.
|
|
|
The image on the right shows 1 in every 8 particles.
|
|
|
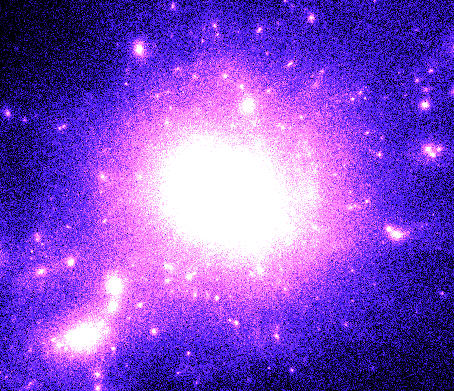
This image shows every particle, the same camera settings
are the same as the image above.
|
|
|
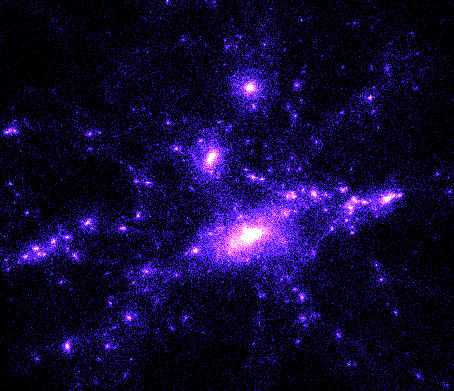
PVIEW also supports multiple time steps, the image
on the right is one time step (z=1.16) from many.
|
|
|
The following example illustrates one user module called MLAPM.
MLAPM is a multilevel
adaptive mesh cosmological N-body code, the simulation data
shown on this web page was created using MLAPM.
Integral to the interpretation of N-body cosmological data is the use of
Halo finders. The analysis software MLPAM Halo Finder (MHF) and MLAPM Halo
Tracker (MHT) have been created to analyse the MLAPM output and produce a
file that can be read by PVIEW to assist the verification of the analysis.
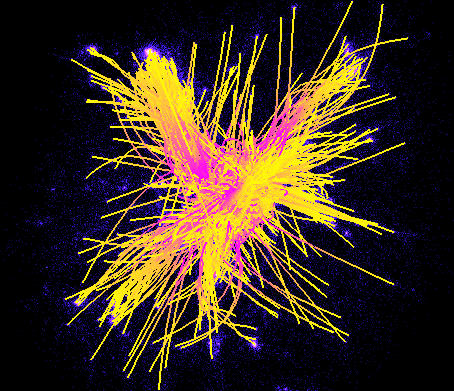
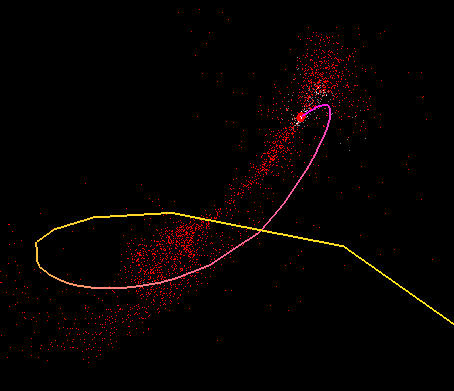
The following shows the orbits of all the satellites in the high
resolution region of this simulation.
In the next image (below right)
individually tracked satellites within the simulation
are illustrated.
Notice their interesting orbital shapes and tidal streams.
|
|
|
This visualisation project has been sponsored by the Apple University
Consortium through the Apple University Development Fund (AUDI) by the
provision of a dual Dual 2GHz PowerPC G5. The new G5 is the ideal machine to
develop an application such as PVIEW pushing graphics acceleration to the limit.
Further, the memory advantages of the G5 allow us to visualise large complex datasets.

|
|