Introduction to the Mandelbrotwritten by Ruben van NieuwpoortThe Mandelbrot sets is named after Benoit Mandelbrot. It is mostly know for the pretty pictures it can produce, while being relatively easy to render. DefinitionThe Mandelbrot is a subset of the complex numbers. It consists of the complex numbers for which the magnitude of the elements in the sequence Since every complex number has both a real and an imaginary part, the space of complex numbers is two-dimensional and maps nicely to a computer screen. By convention, the y-axis corresponds to the imaginary part of , and the x-axis to the real part. Plots of the set are obtained by seeing if the magnitude of the complex iterands is bigger than some predefined escape radius. It can be shown that a radius of 2 is big enough, in the sense that if we have for some , then . If the magnitude of the iterand is not bigger than the escape radius after some predefined maximum number of iterations, the point is considered to be in the Mandelbrot set. So, plots are merely an approximation.
This plot doesn’t really do justice to the beauty of the Mandelbrot set. First, it is monochrome. More interesting pictures can be obtained by using a color that is based on the iteration number in which the magnitude of the iterand first exceeded the escape radius.
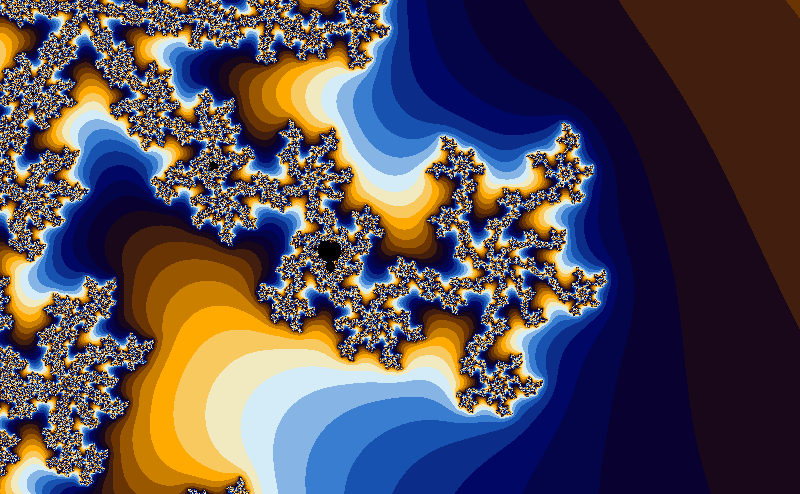
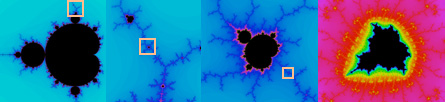
It looks even better when you use a smooth coloring scheme, which approximates the iteration count with a continuous function, which gives a much smoother appearance. Second, the most interesting pictures of the Mandelbrot set can be obtained by zooming in on regions near the border. Sometimes, regions are similar to the whole Mandelbrot set.
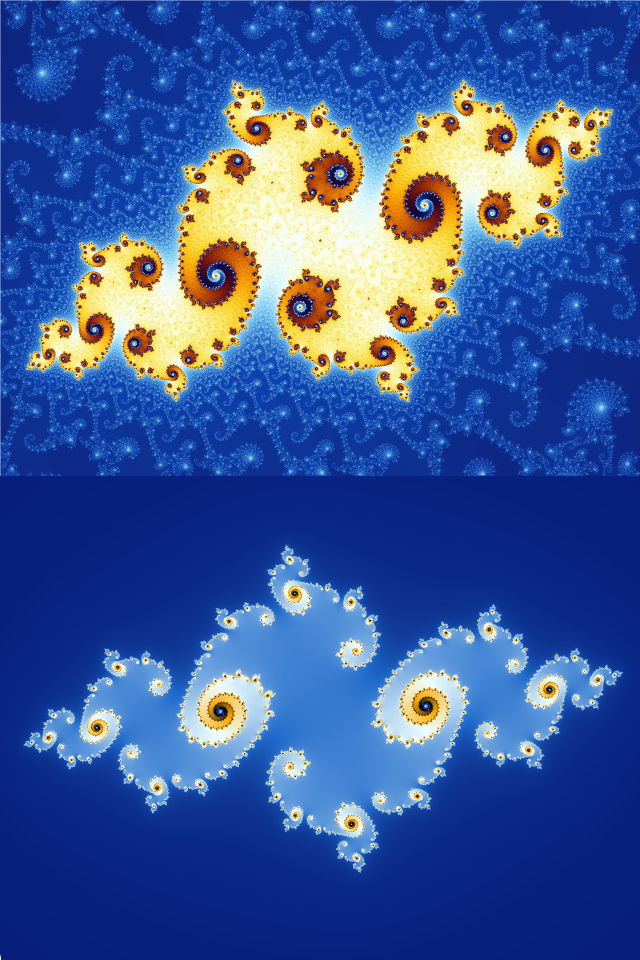
Pseudocode to plot the Mandelbrot setThis pseudocode plots a monochrome plot of the Mandelbrot set. Julia setsThe Julia set of the map is related to the Mandelbrot set. The formal definition of the Julia set is a bit tricky (by this I mean that I don’t understand it at the time of writing…). For the Mandelbrot set, it can be obtained as the set of complex numbers for which the sequence It is interesting to note that there is some similarity between some regions in the Mandelbrot set, and some of the Julia sets of the mapping .
Further readingThe wikipedia pages for the Mandelbrot set and the Julia set are excellent and contain much more information than this article. The information on the various algorithms used for coloring is especially useful. Paul Bourkes personal site has a section of his site dedicated to fractals. Especially relevant are his articles about the Mandelbrot set and the Julia set. Inigo Quilez’ site has written a lot of useful articles about fractals. The Buddhabrot is strongly related to the Mandelbrot fractal. The plot is obtained by plotting every iterand . This article by Paul Bourke is a nice introduction, just like this article by Melinda Green. |
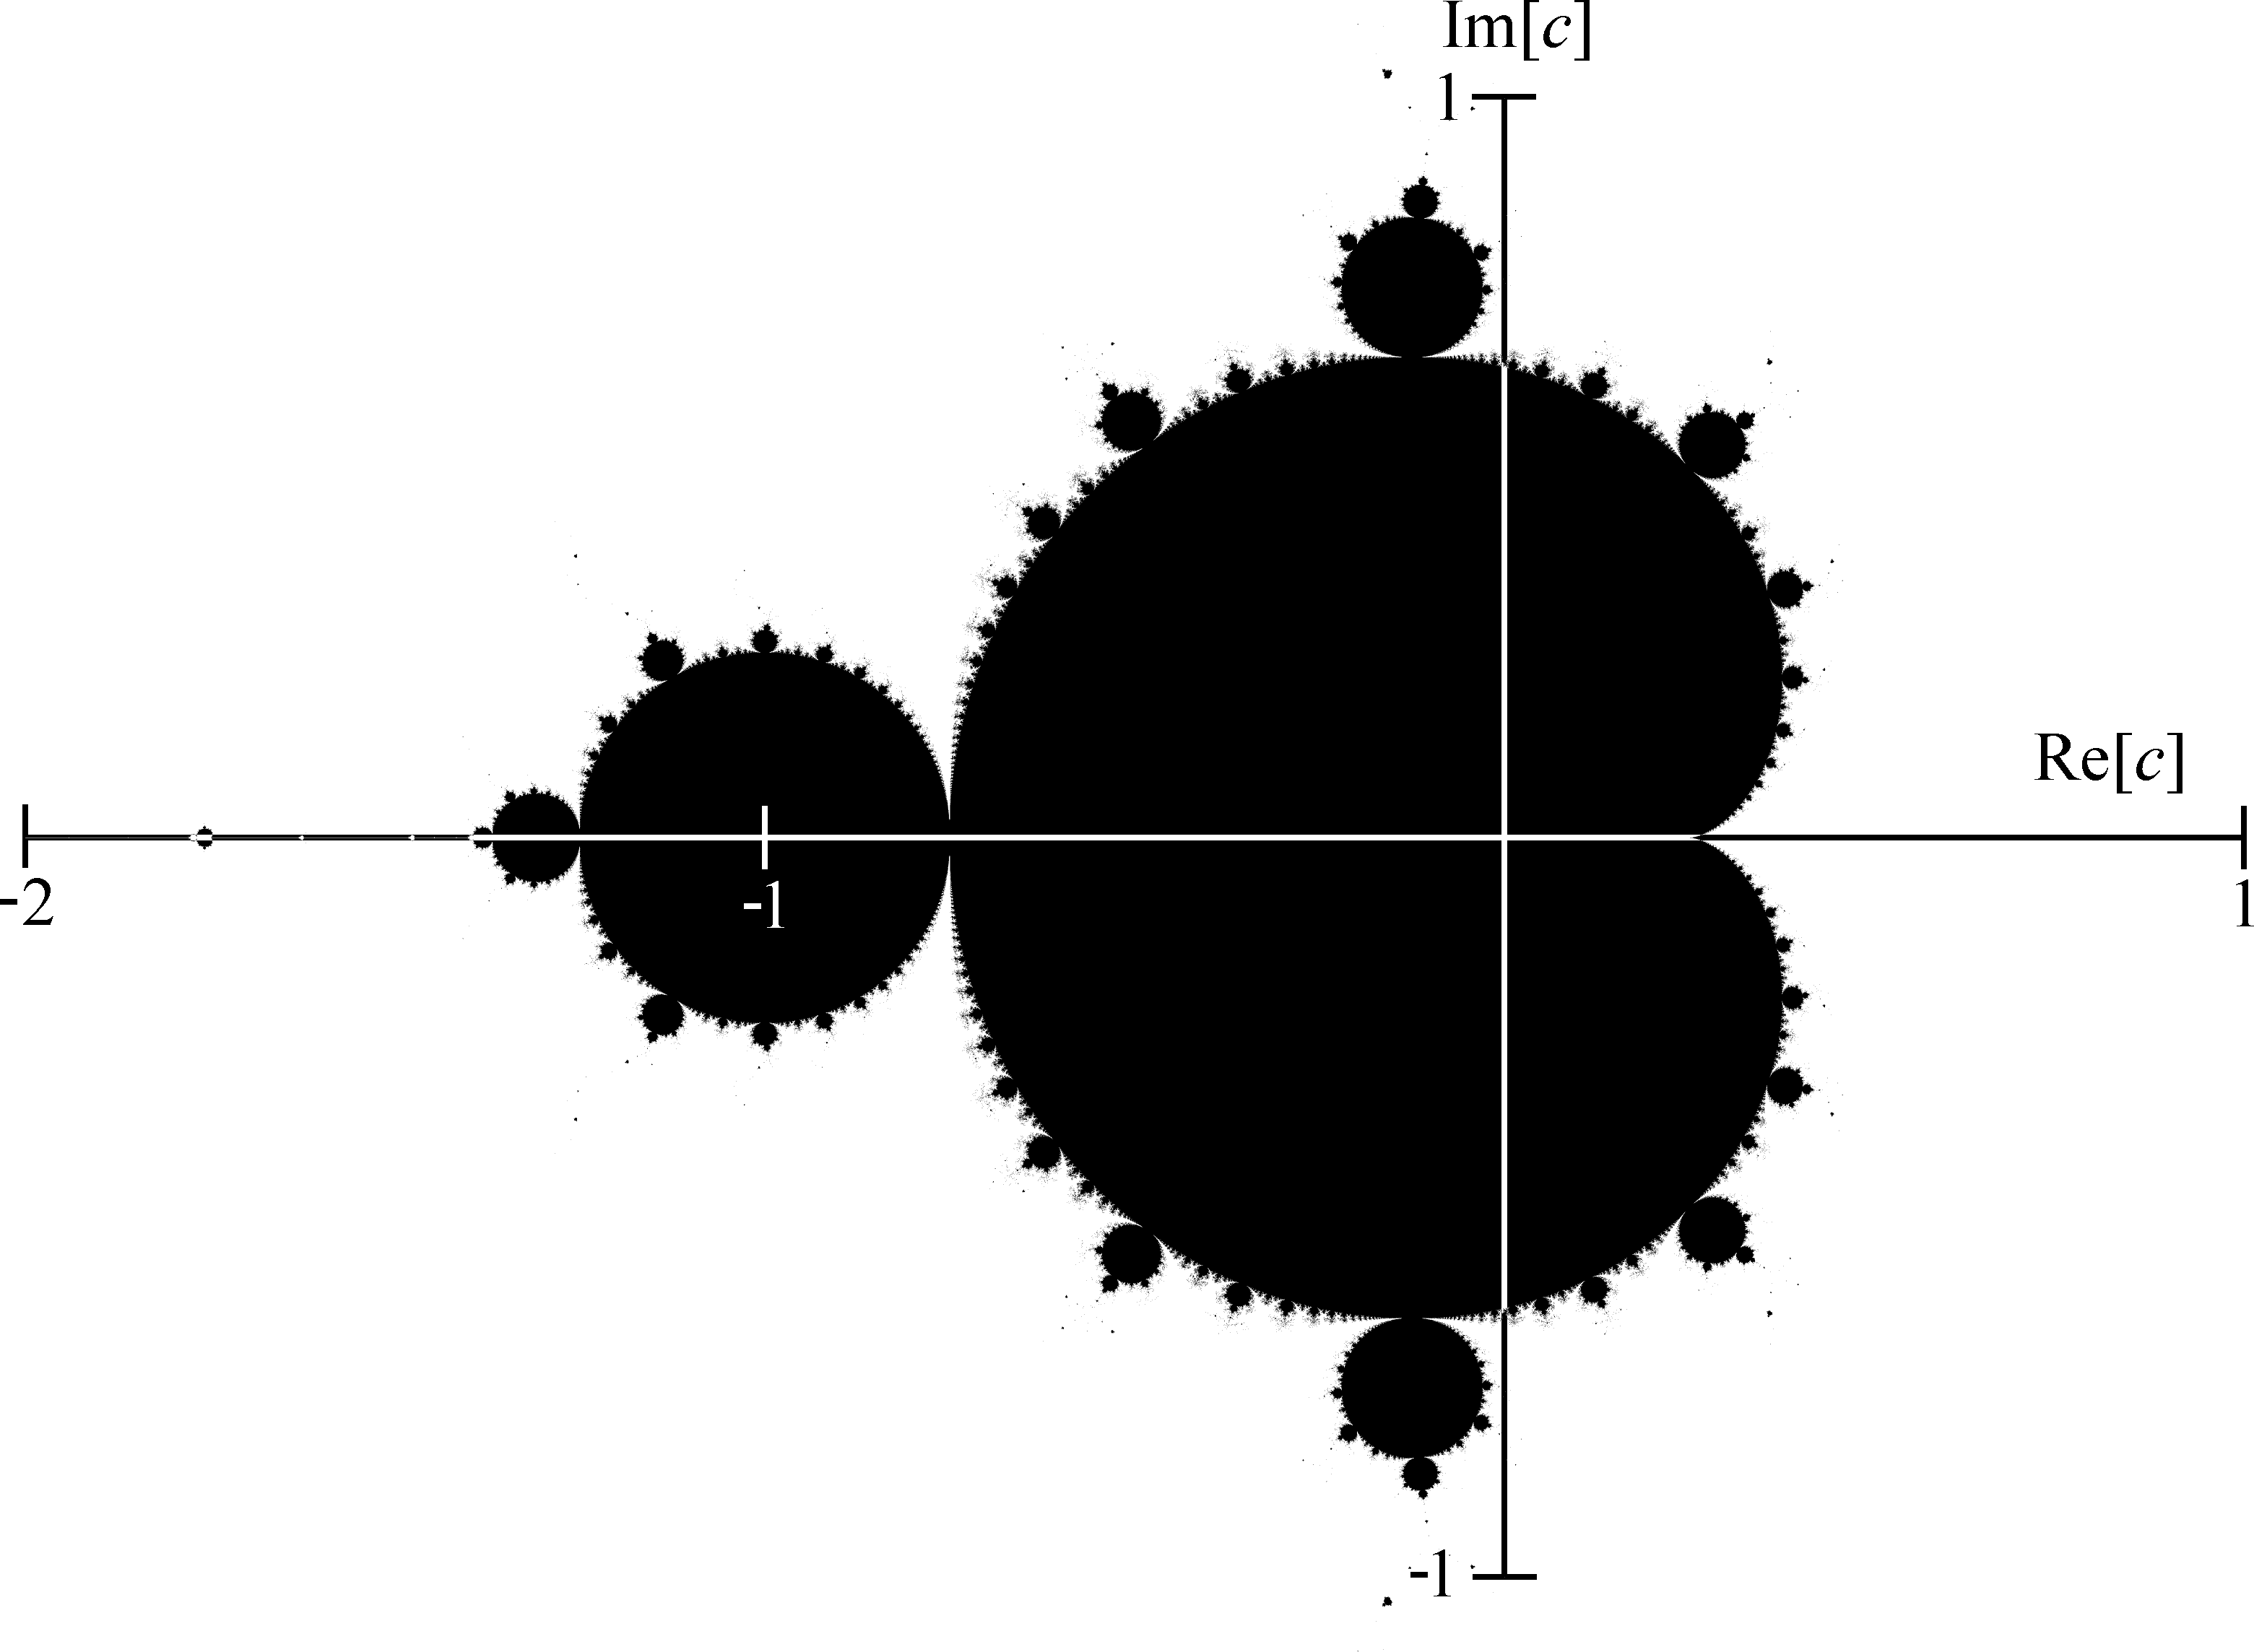 A plot of the Mandelbrot set from Wikipedia, along with the real and imaginary axes.